
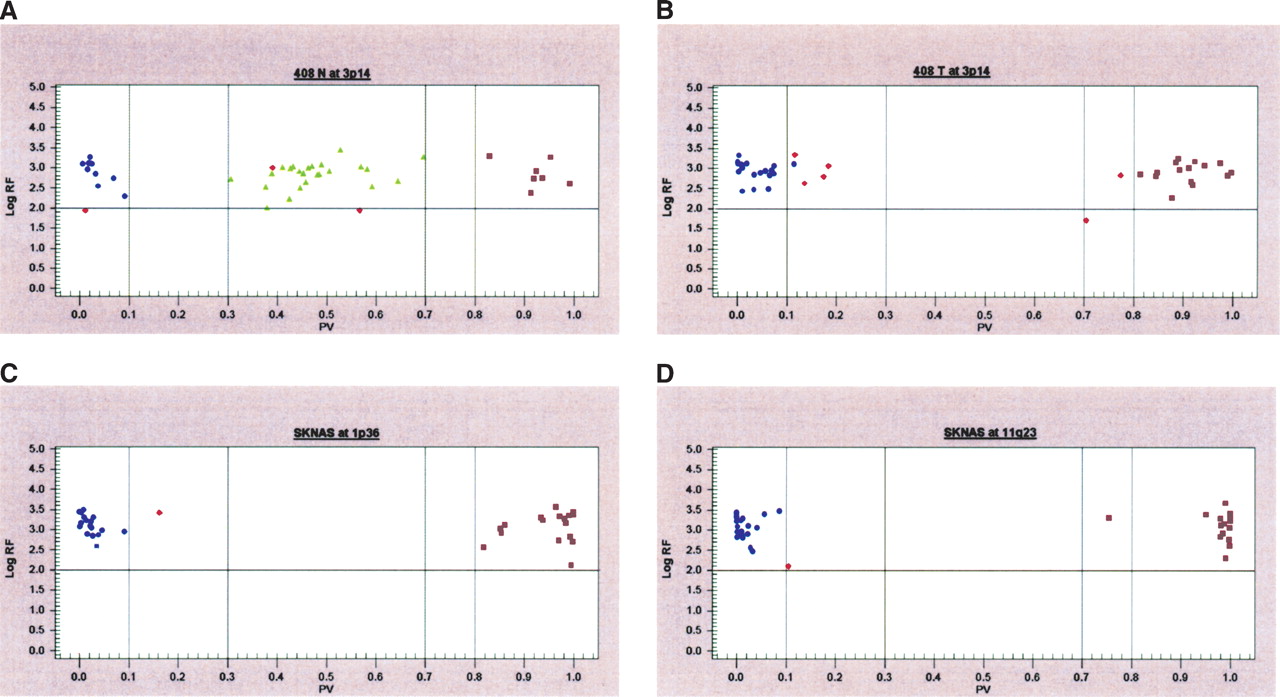
Cluster analysis of GenFlex Tag Array hybridization results. SNP calls are shown comparing (A) constitutional DNA to (B) primary tumor DNA from the same neuroblastoma sample and SK-N-AS cell line (C,D) DNA interrogating 1p36 and 11q23 regions both showing LOH. Blue circles and purple squares represent homozygous SNPs, while green triangles represent heterozygous SNPs. The X-axis represents the fraction of X allele signal [value = (X signal/(X + Y signals)], such that points near 1 represent XX homozygotes, those near 0 represent YY homozygotes, and points toward the middle XY heterozygotes. The software first uses a generic set of thresholds (the dashed vertical lines) to differentiate regions along the X-axis into each genotype cluster, leaving regions for potentially ambiguous data to remain as a “no call” (red data points). The Y-axis represents the log of the sum of both allele signals, leading to a confidence threshold or signal-to-noise cutoff (horizontal solid line), with points below this level representing “no call” data as well. The graphs show all of the SNP assays that were designed and attempted, thus although failed assay designs are still included in this data view, it is clear that several meaningful data points are gathered.


