
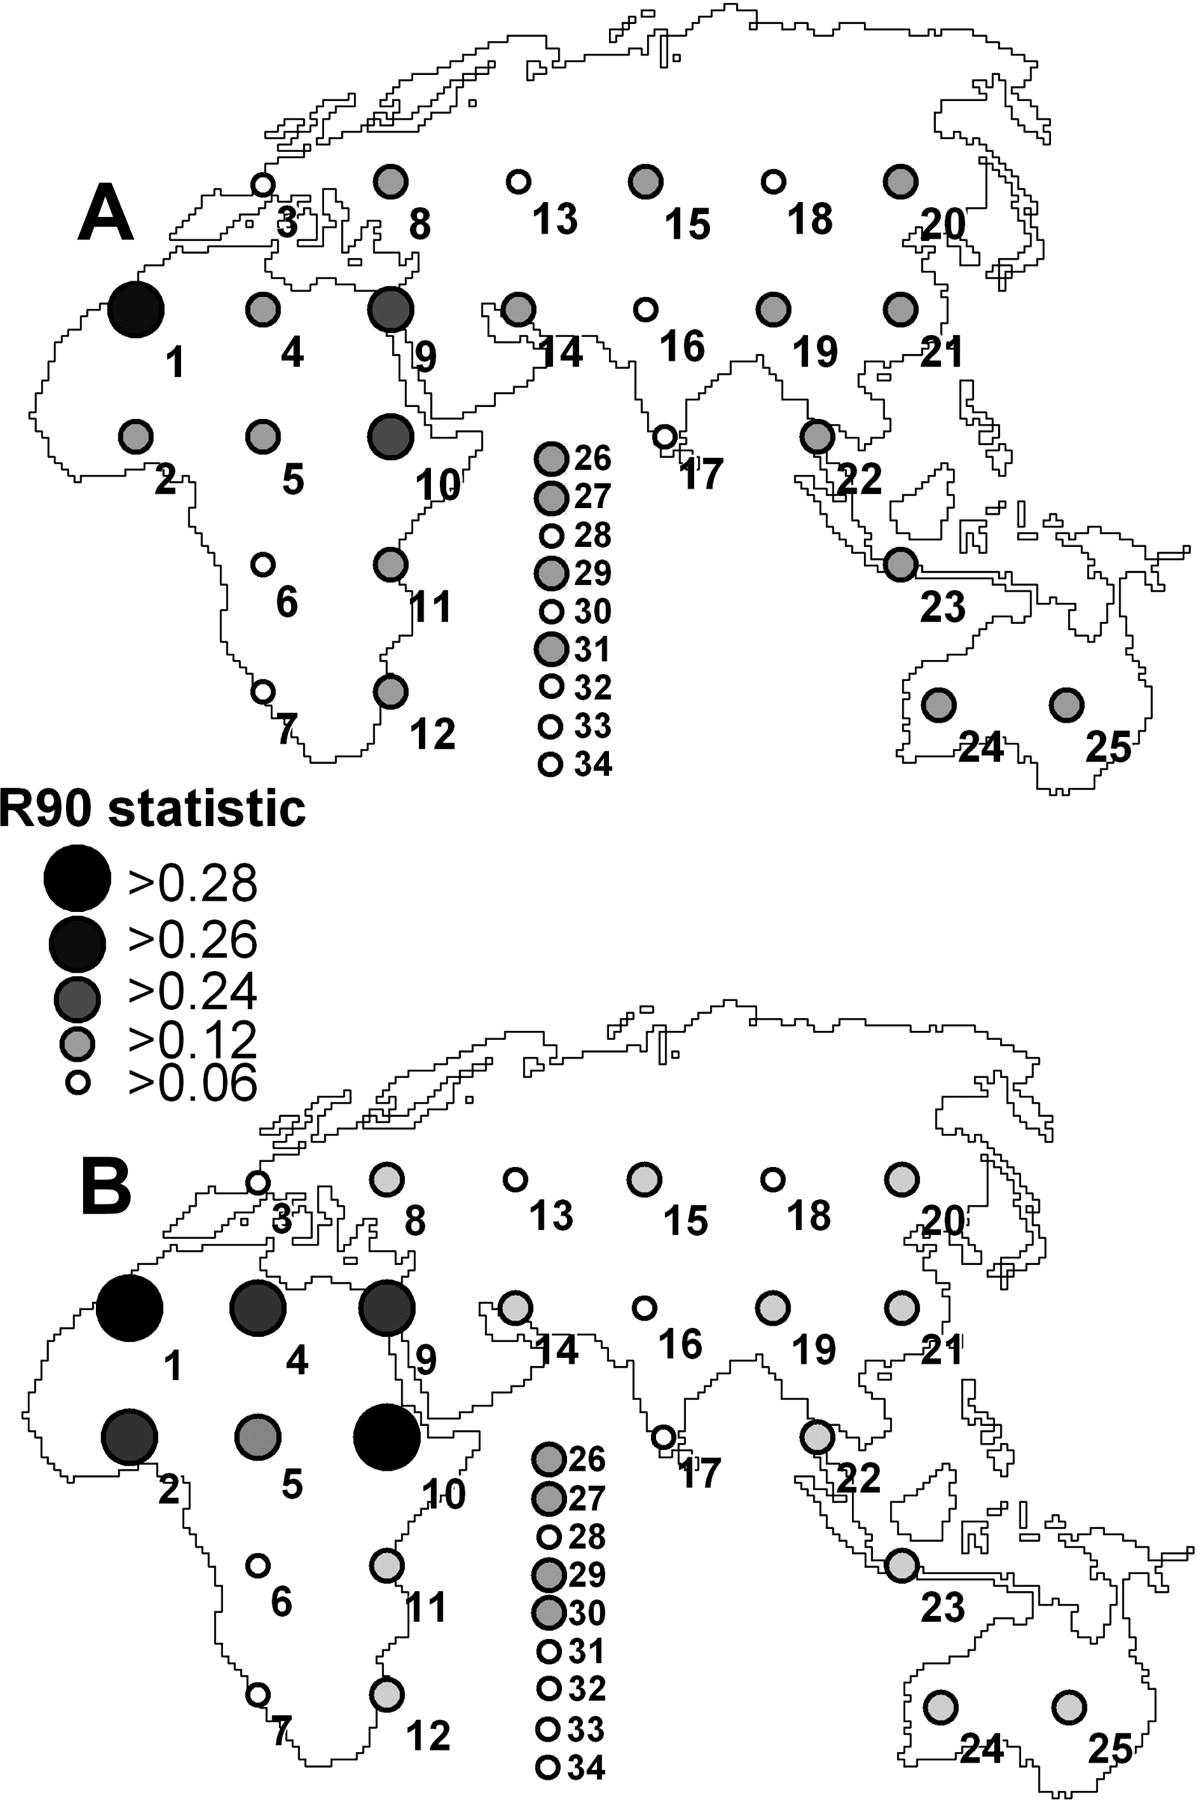
Figure 4.
Values of the R90 statistic for 25 UO scenarios (nos. 1–25) and nine ME scenarios (nos. 26–34) computed from the Rosenberg22 data set under the unbiased (A) and biased (B) simulated data sets. Exact values of the R90 statistics are reported in Supplemental Table 2.


