
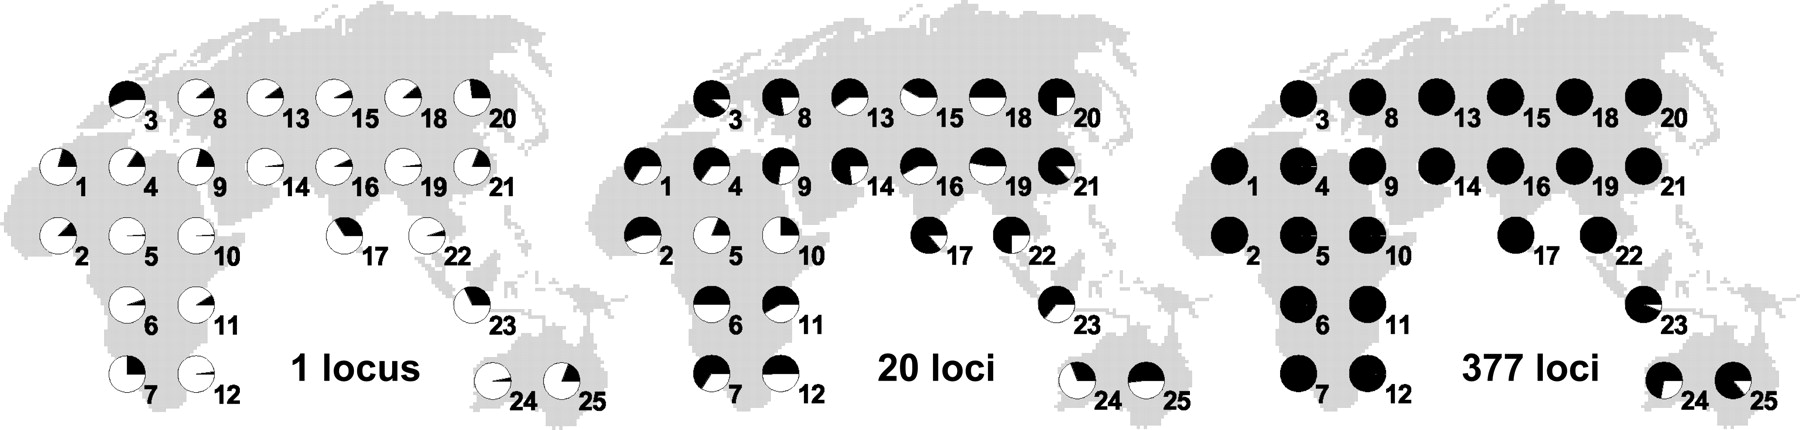
Figure 3.
Relative frequencies of correct assignment for 25 simulated origins and for different numbers of available STR loci. The black area represents the proportion of simulations for which the origin of demographic expansion was correctly recovered from the R90 statistic. The frequencies of correct assignment for the complete set of simulations are given in Table 2.


