
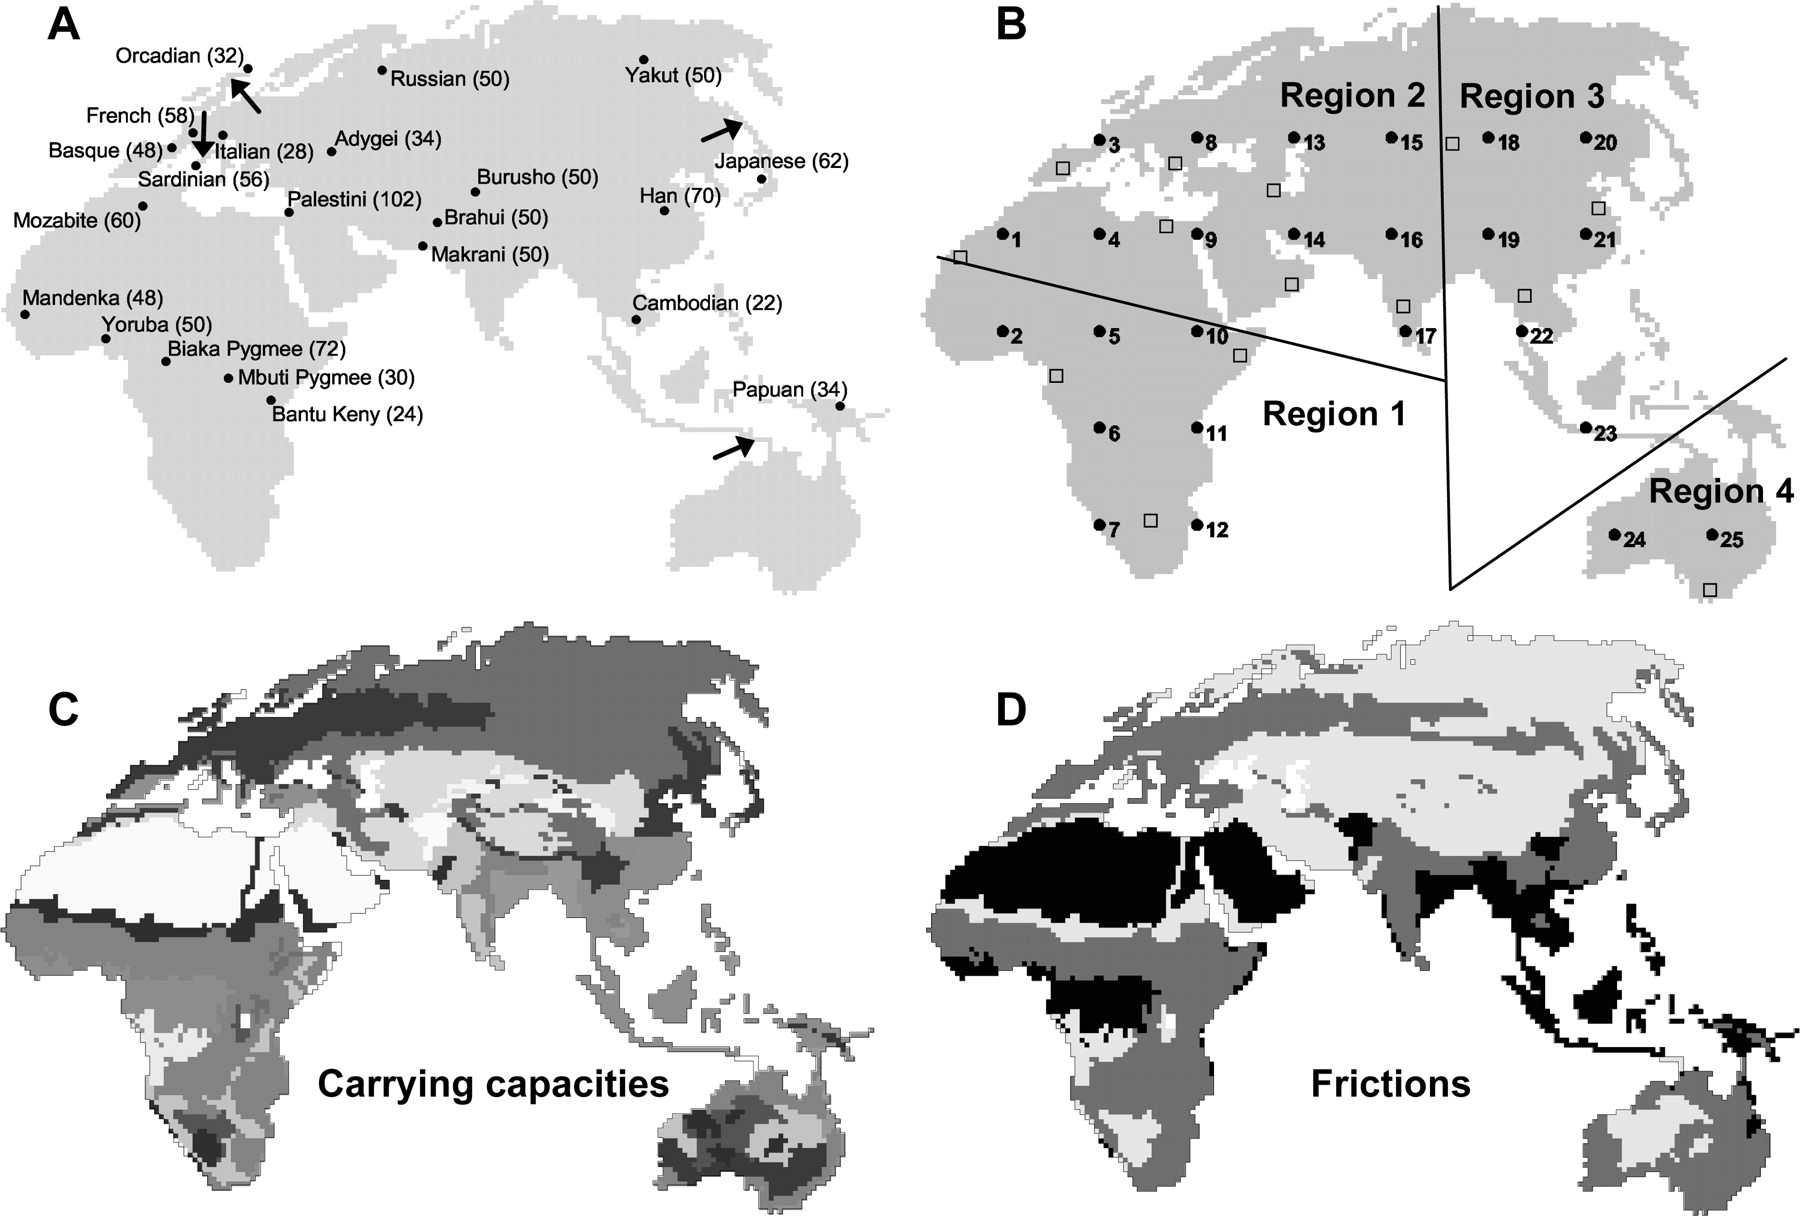
(A) Location, name, and size (within parentheses) of the 22 populations drawn from Rosenberg et al. (2002) for which genetic diversity was simulated. Arrows indicate the location of the four land bridges introduced to allow the complete colonization of the Old World and Oceania, since four samples (Orcadian, Sardinian, Japanese, and Papuan) are localized in islands. We imposed a low carrying capacity (K = 10) for demes located on these bridges to simulate a likely Founder Effect associated with the settlement of these islands. (B) Location of the 25 simulated origins (black dots). Open squares indicate the location of the 14 pseudo-observed origins. The four genetic regions defined in Rosenberg et al. (2002) are defined by the straight black lines. (C) Representation of relative carrying capacity values. (D) Representation of relative friction values. In C and D, darker colors indicate relatively higher carrying capacity or friction values.


