
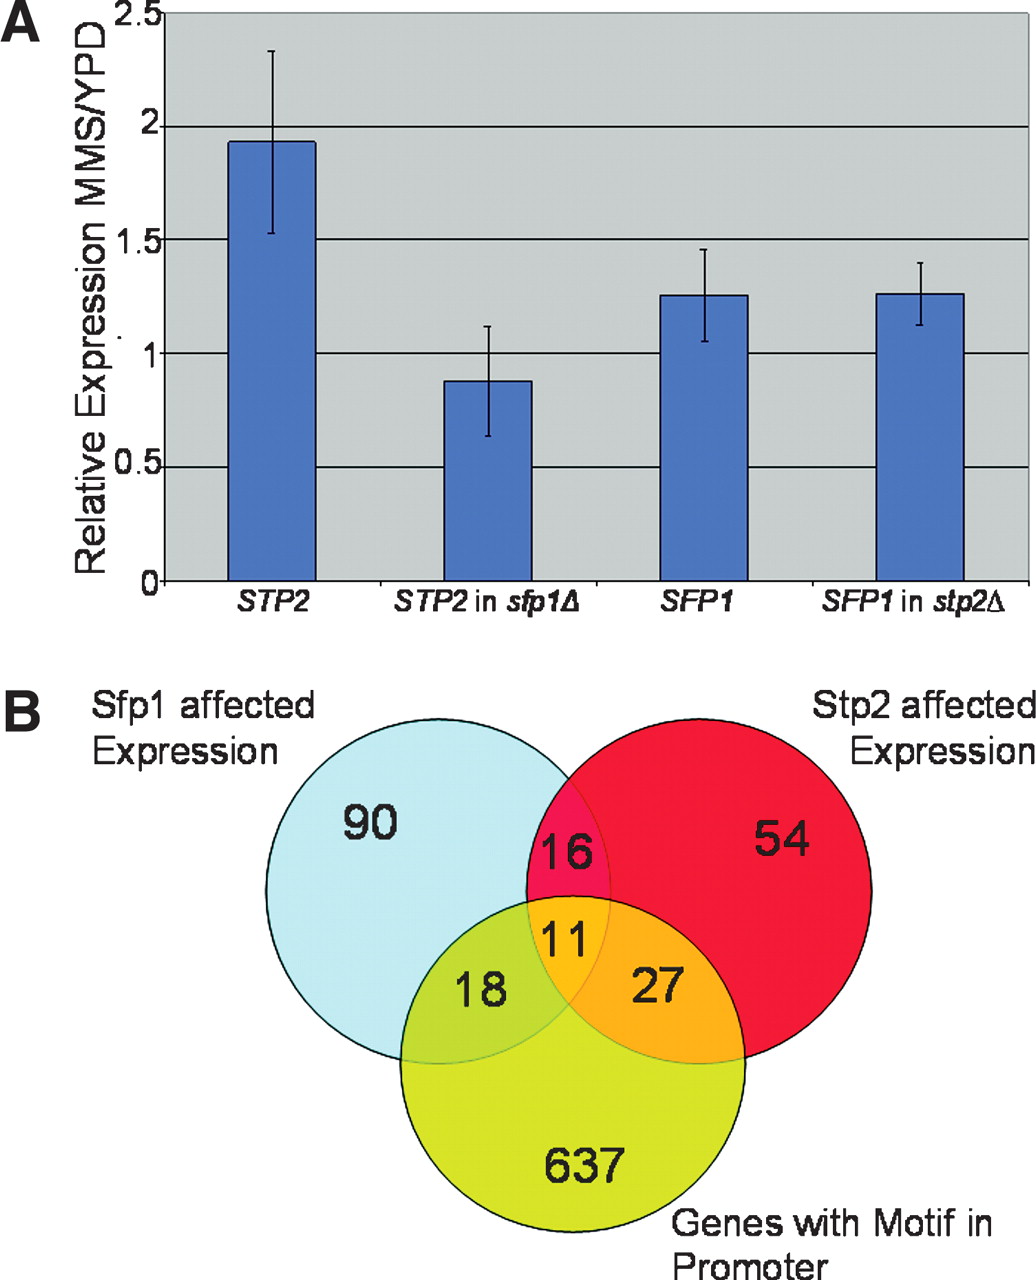
Figure 5.
Microarray experiments. (A) Comparison of STP2 and SFP1 gene expression. Bar height shows the expression in MMS relative to a reference sample divided by expression in YPD compared with the same reference sample; error bars represent 1 SD. (B) Venn diagram showing the overlap of genes whose expression is significantly altered in an stp2Δ mutant, genes whose expression is significantly altered in an sfp1Δ mutant, and genes that contain a copy of the motif in their promoter.


