
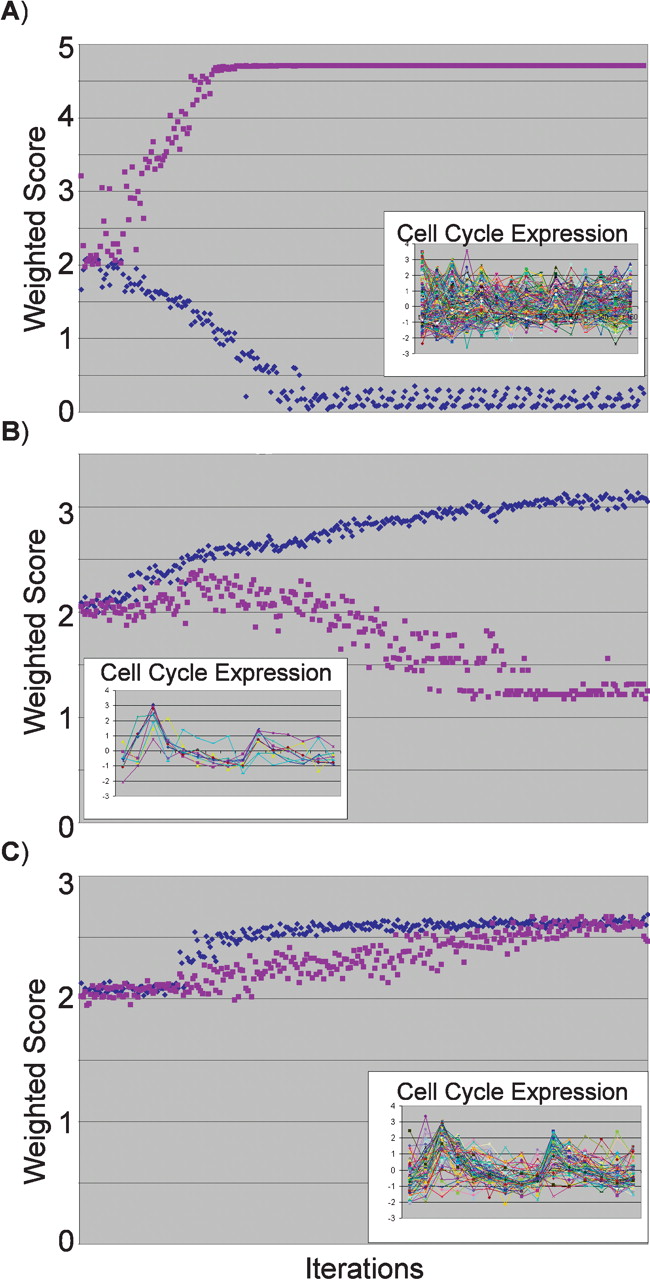
Figure 1.
Optimizing the MCB Box motif. The information content scores (blue ♦) and conservation scores (purple ▪) are plotted during iterative rounds of optimization while selecting for conservation only (A), information content only (B), or the sum of information content and conservation (C). (Insets) The cell-cycle expression (Cho et al. 1998) of promoters containing sequences matching the final optimized motif in each case. The x-axis represents experimental timepoints through the cell cycle, and the y-axis represents relative gene expression levels.


