
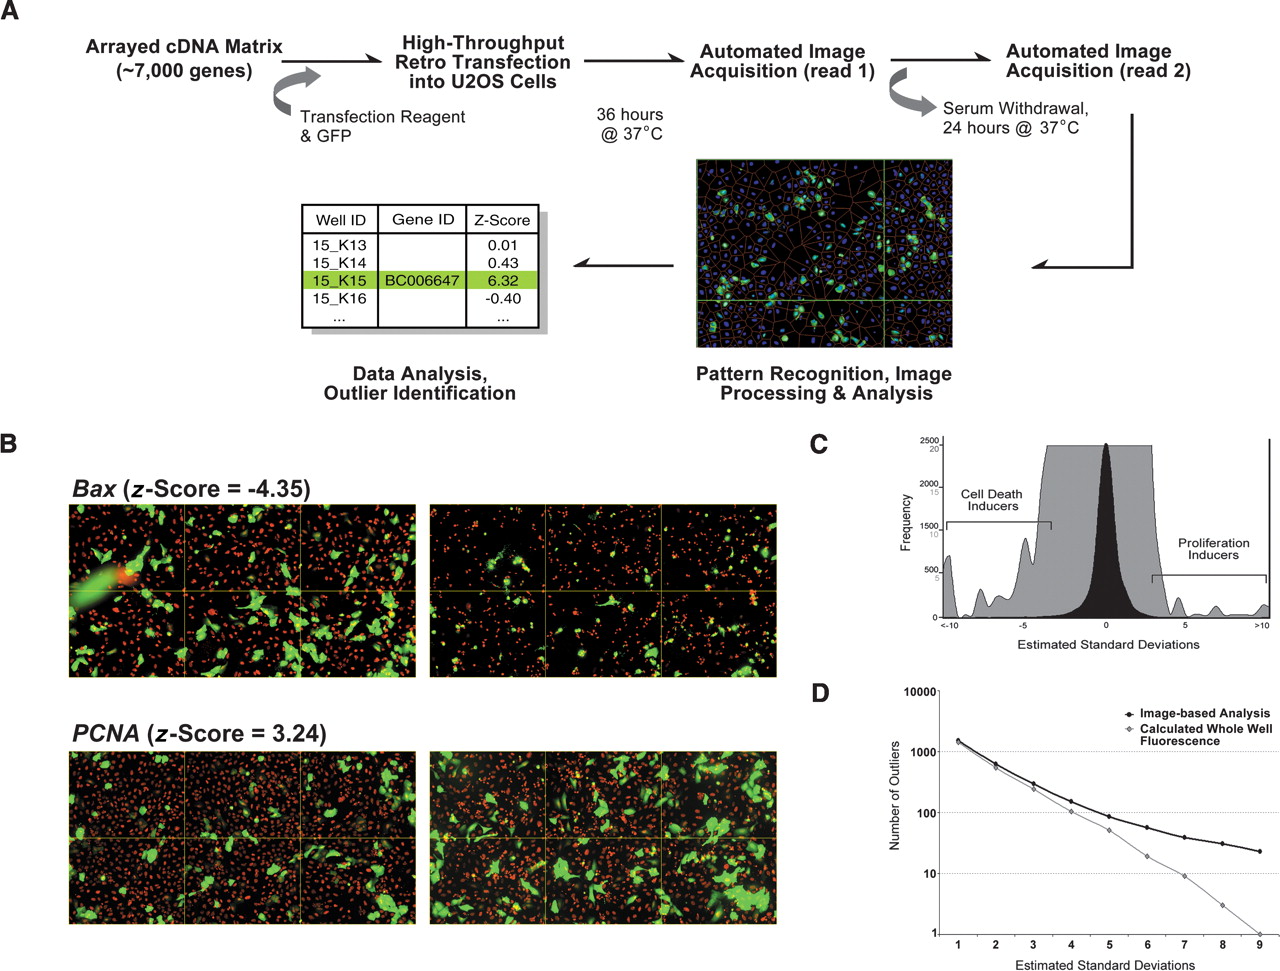
Screen for mammalian growth regulatory factors by high-content imaging. (A) Screen work flow. Here, 7364 individually arrayed mammalian cDNAs were cotransfected with a GFP expression construct into U2OS cells. Cells were imaged in an automated manner using the Q3DM EIDAQ100 automated fluorescent microscope at 36 h post-transfection (read 1). Then, 24 h after exchanging normal culturing media for serum-depleted media, the image acquisition procedure was repeated (read 2). Image sets were analyzed using Cytoshop software. (B) Representative image table montages. Images from wells cotransfected with GFP and Bax or PCNA are shown together with their z-scores. Image sets in left panels were taken at time of serum-withdrawal. Right panel images were taken after 24 h of continued growth. Hoechst 33342 DNA stain is shown in red. (C) Frequency distribution of observed gene activities. Changes observed in GFP-positive cell growth in each well are presented as estimated standard deviations, and reflect the variance in well-to-well proliferation rates induced by a gene activity, relative to the plate mean. To enable the visualization of outliers, an enlargement of the total screen distribution (black) is shown in gray. Frequencies for each representation are indicated on the y-axis, respectively. (D) The relative sensitivity of whole-well fluorescence and image-based detection methodologies was assessed by determining the cumulative number of statistically significant outlier events (i.e., apoptosis and proliferation) as a function of estimated standard deviations from respective experimental medians (see Methods).


