
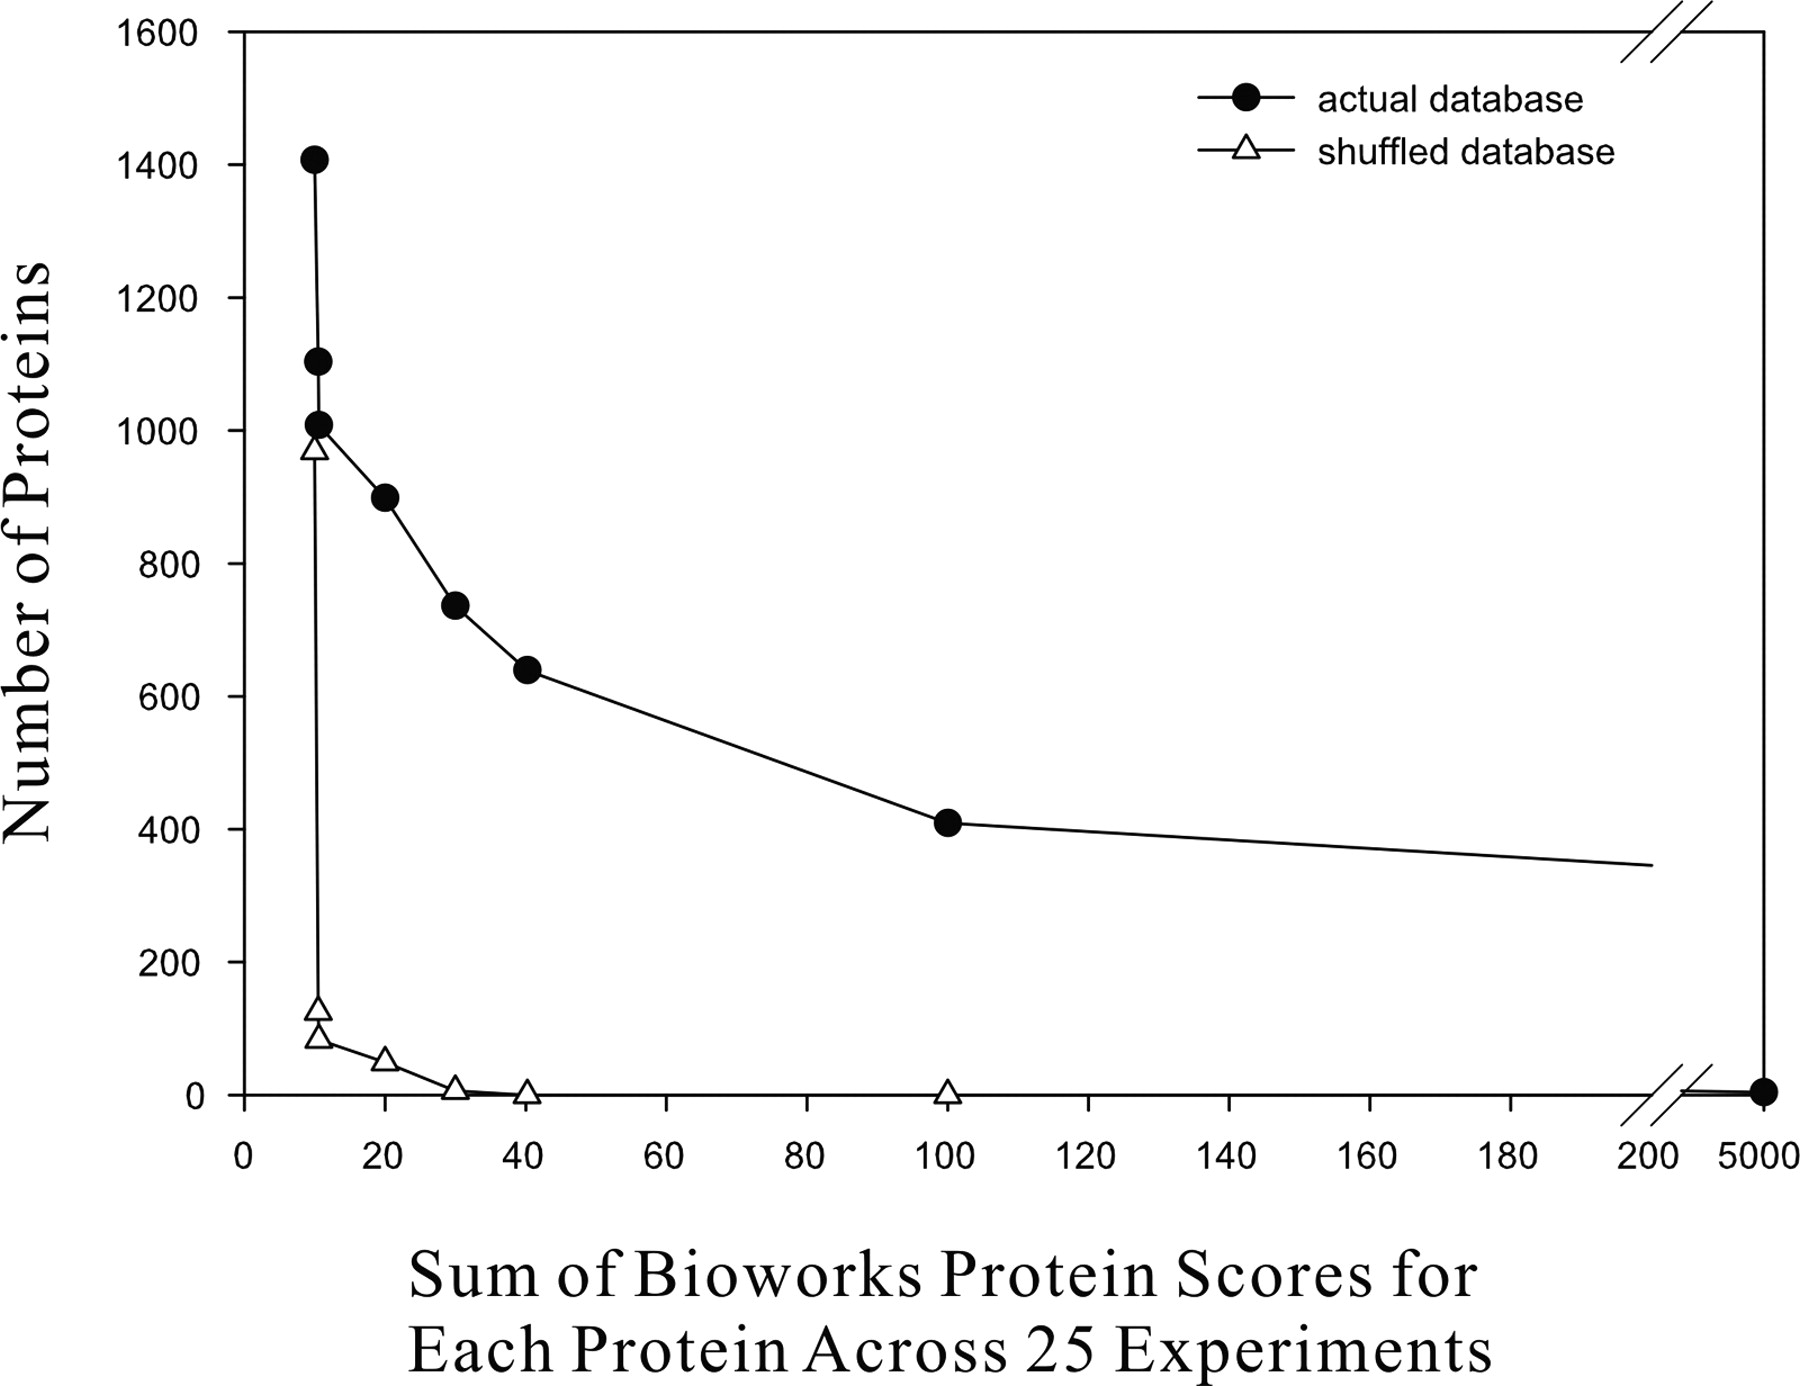
Figure 7.
Estimating the protein identification error rate. The false-positive protein identification rate (triangles; estimated by comparing MS/MS spectra against a mass spectrometry reference database of shuffled M. smegmatis proteins) is plotted as a function of total BioWorks score for each protein. At a false-positive identification rate of ∼5% (corresponding to proteins with total scores >20 across the 25 experiments), 899 proteins are identified (circles).


