
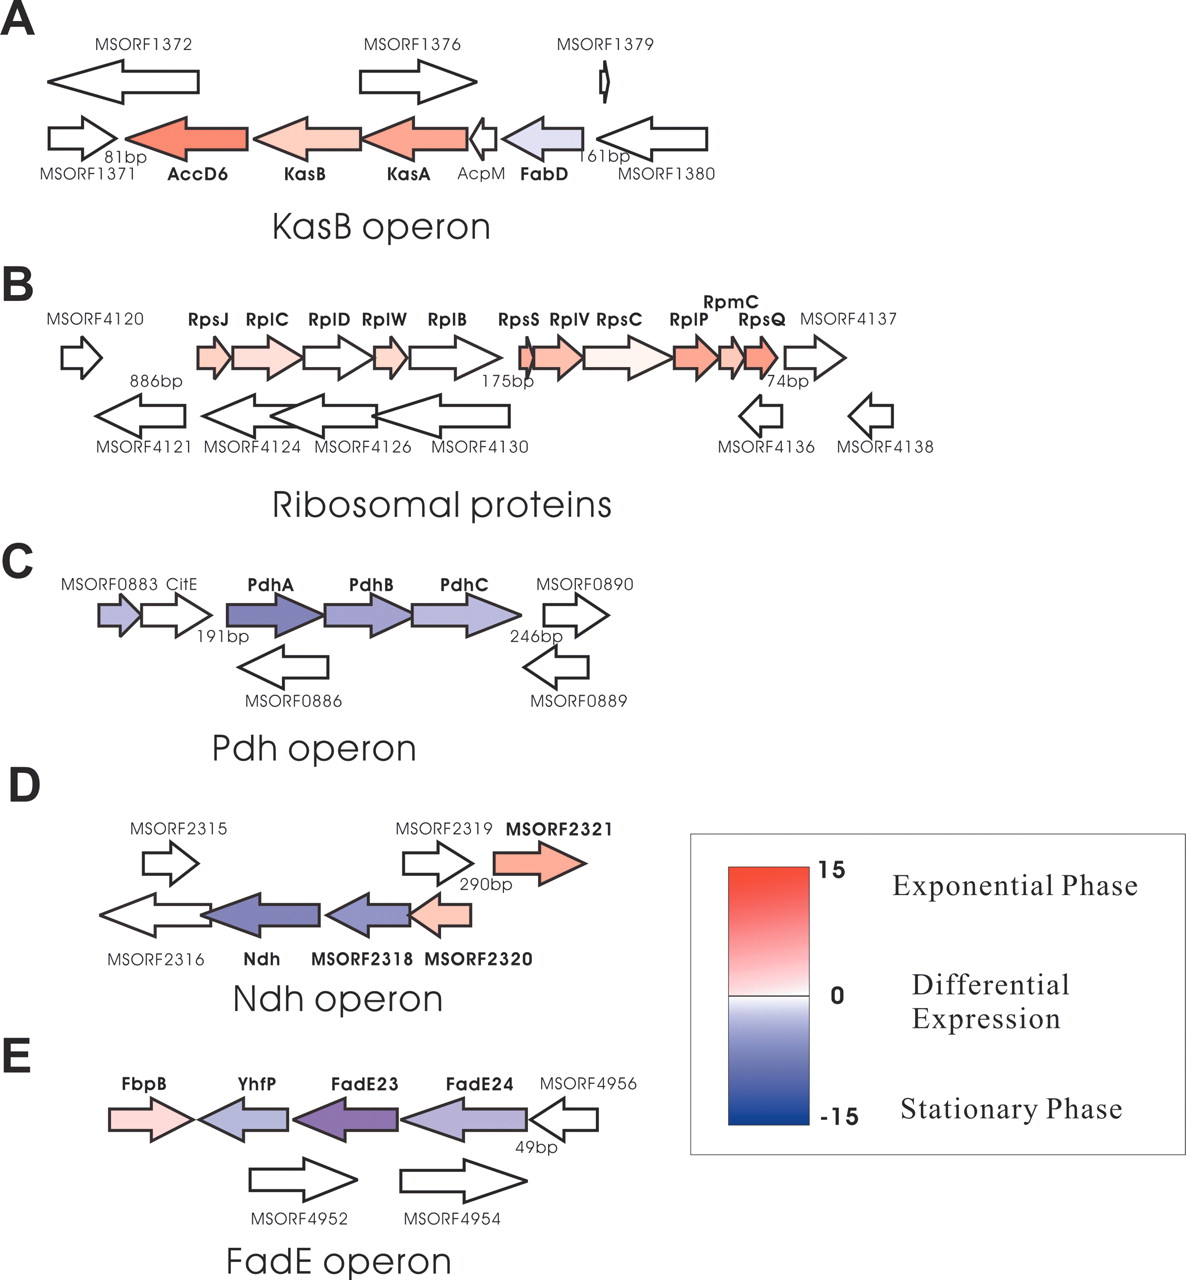
Figure 6.
Proteins in the same operon coexpress in a growth-phase-specific manner. The color scale represents the relative expression
of the protein between exponential phase (red) and stationary phase (blue), calculated as (number of observations in exponential
phase)  (number of observations in stationary phase). The KasB operon (A) and RpsJ, RpsS operons (B) are up-regulated in exponential phase; the PdhABC (C), Ndh operon (D), and FadE operon (E) are up-regulated in stationary phase.


