
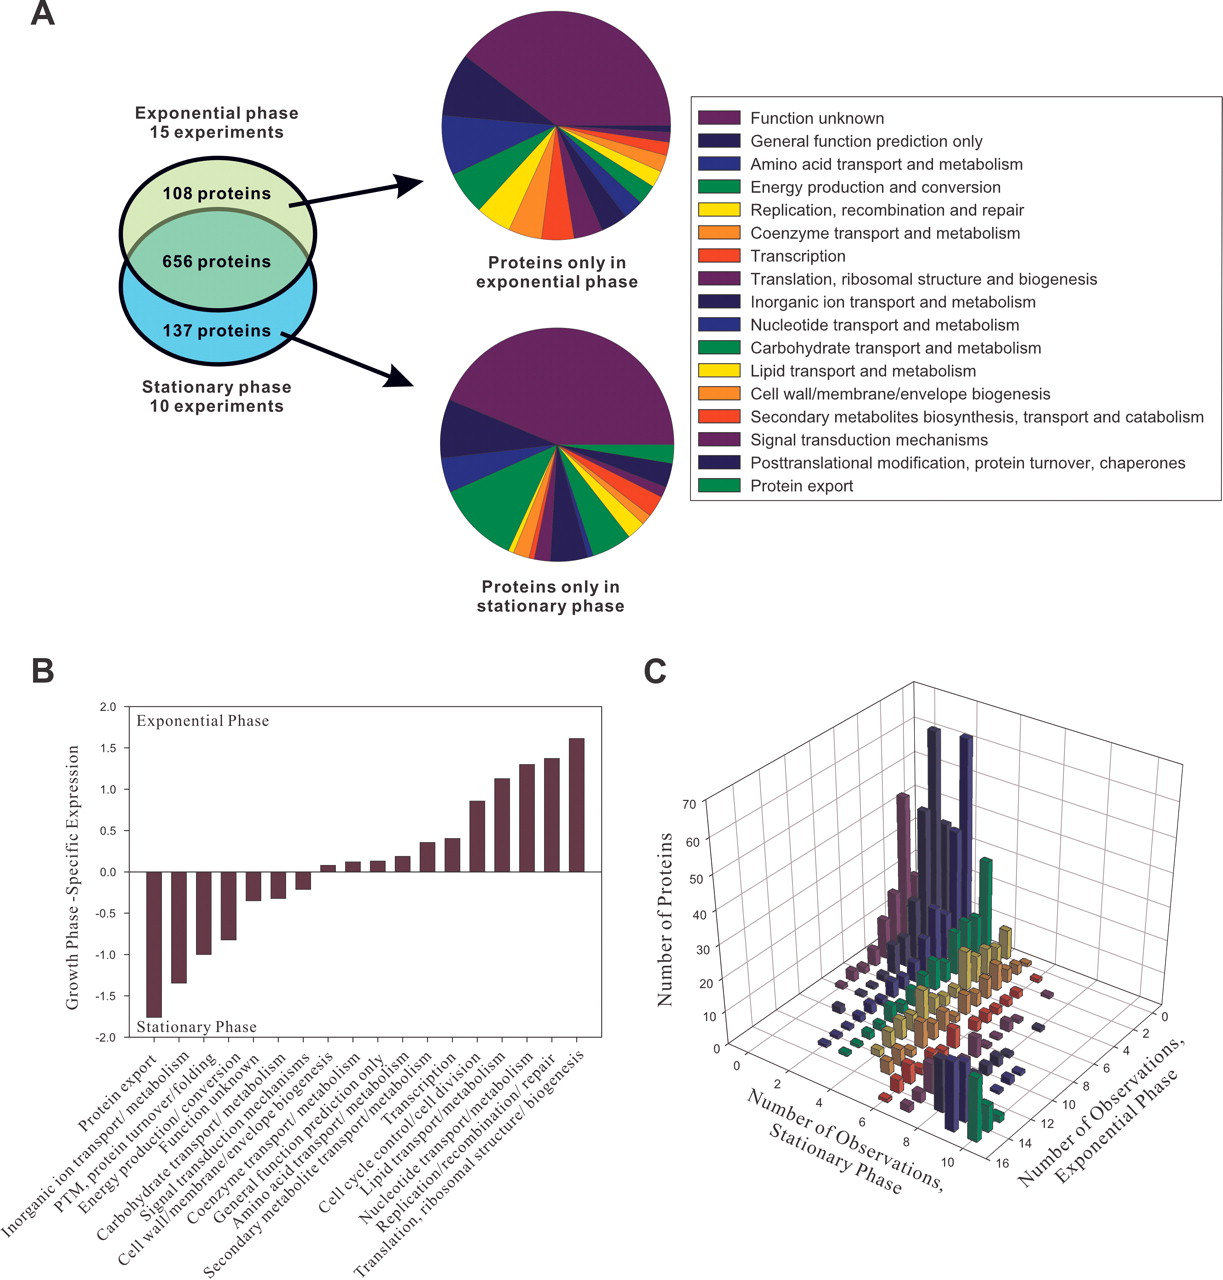
A comparison of the proteomes of exponential and stationary-phase cells. (A) The overlap of identified proteins in exponential and stationary phases (left chart), showing the functions of proteins specific to exponential phase (top right chart) or stationary phase (bottom right chart). For clarity, proteins with uncharacterized functions are excluded from the pie charts. (B) COG functions for the proteins differentially expressed in exponential and stationary phases. For the proteins in each COG
category, we plot the mean difference in expression level, calculated as mean ( ), where Nexp,i and Nstat,i are the number of observations of protein i in exponential and stationary phase, respectively. The factor of
  is introduced to scale the number of stationary-phase experiments to match the number of exponential phase experiments. Proteins
of cell growth (translation, replication, etc.) are highly induced in exponential phase, while proteins of transport and energy
production are highly induced in stationary phase. (PTM) Post-translational modification. (C) A 2D histogram plots the distribution of protein abundances and differential expression between stationary- and exponential-phase
cells. The bulk of proteins lie on the diagonal (no differential expression); off-diagonal proteins are differentially expressed
to varying degrees.
is introduced to scale the number of stationary-phase experiments to match the number of exponential phase experiments. Proteins
of cell growth (translation, replication, etc.) are highly induced in exponential phase, while proteins of transport and energy
production are highly induced in stationary phase. (PTM) Post-translational modification. (C) A 2D histogram plots the distribution of protein abundances and differential expression between stationary- and exponential-phase
cells. The bulk of proteins lie on the diagonal (no differential expression); off-diagonal proteins are differentially expressed
to varying degrees.


