
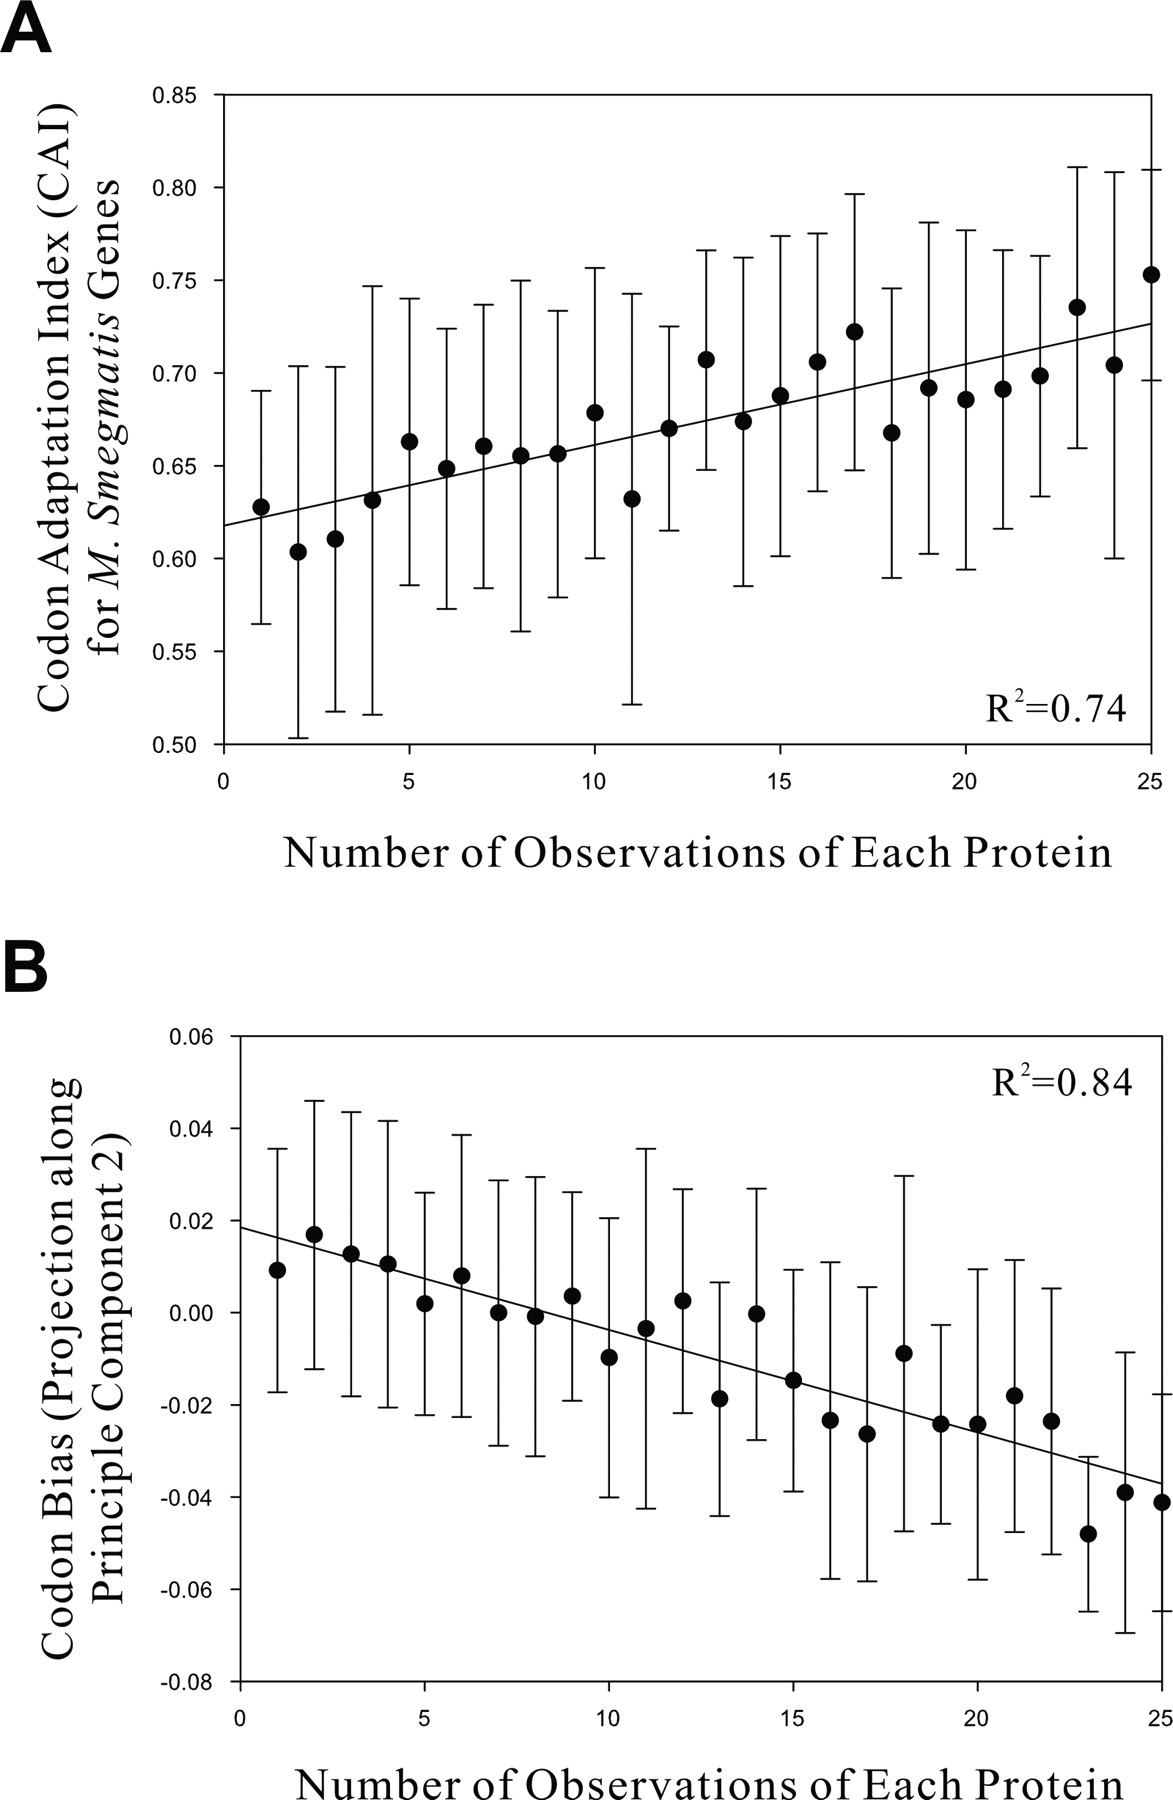
The approximate expression levels of each protein are predicted by two different measures of the codon bias. (A) The number of experiments in which each protein was observed (estimating protein abundance) correlates with the proteins' codon adaptation indices (CAI; R2 = 0.74), indicating that the proteins' average expression levels can be partially predicted from the choice of codons used for each protein. (B) The number of observations of each protein also correlates well with codon bias calculated by principle component analysis of the proteins' codon frequencies. Here, we plot the number of observations of each protein (x-axis) versus the projection of the gene's codon frequencies onto the second principle component (y-axis) (PC2; R2 = 0.84), which best captures variation in codon choice between proteins with high and low expression levels. In this case, PC2 is negatively correlated with protein abundance.


