
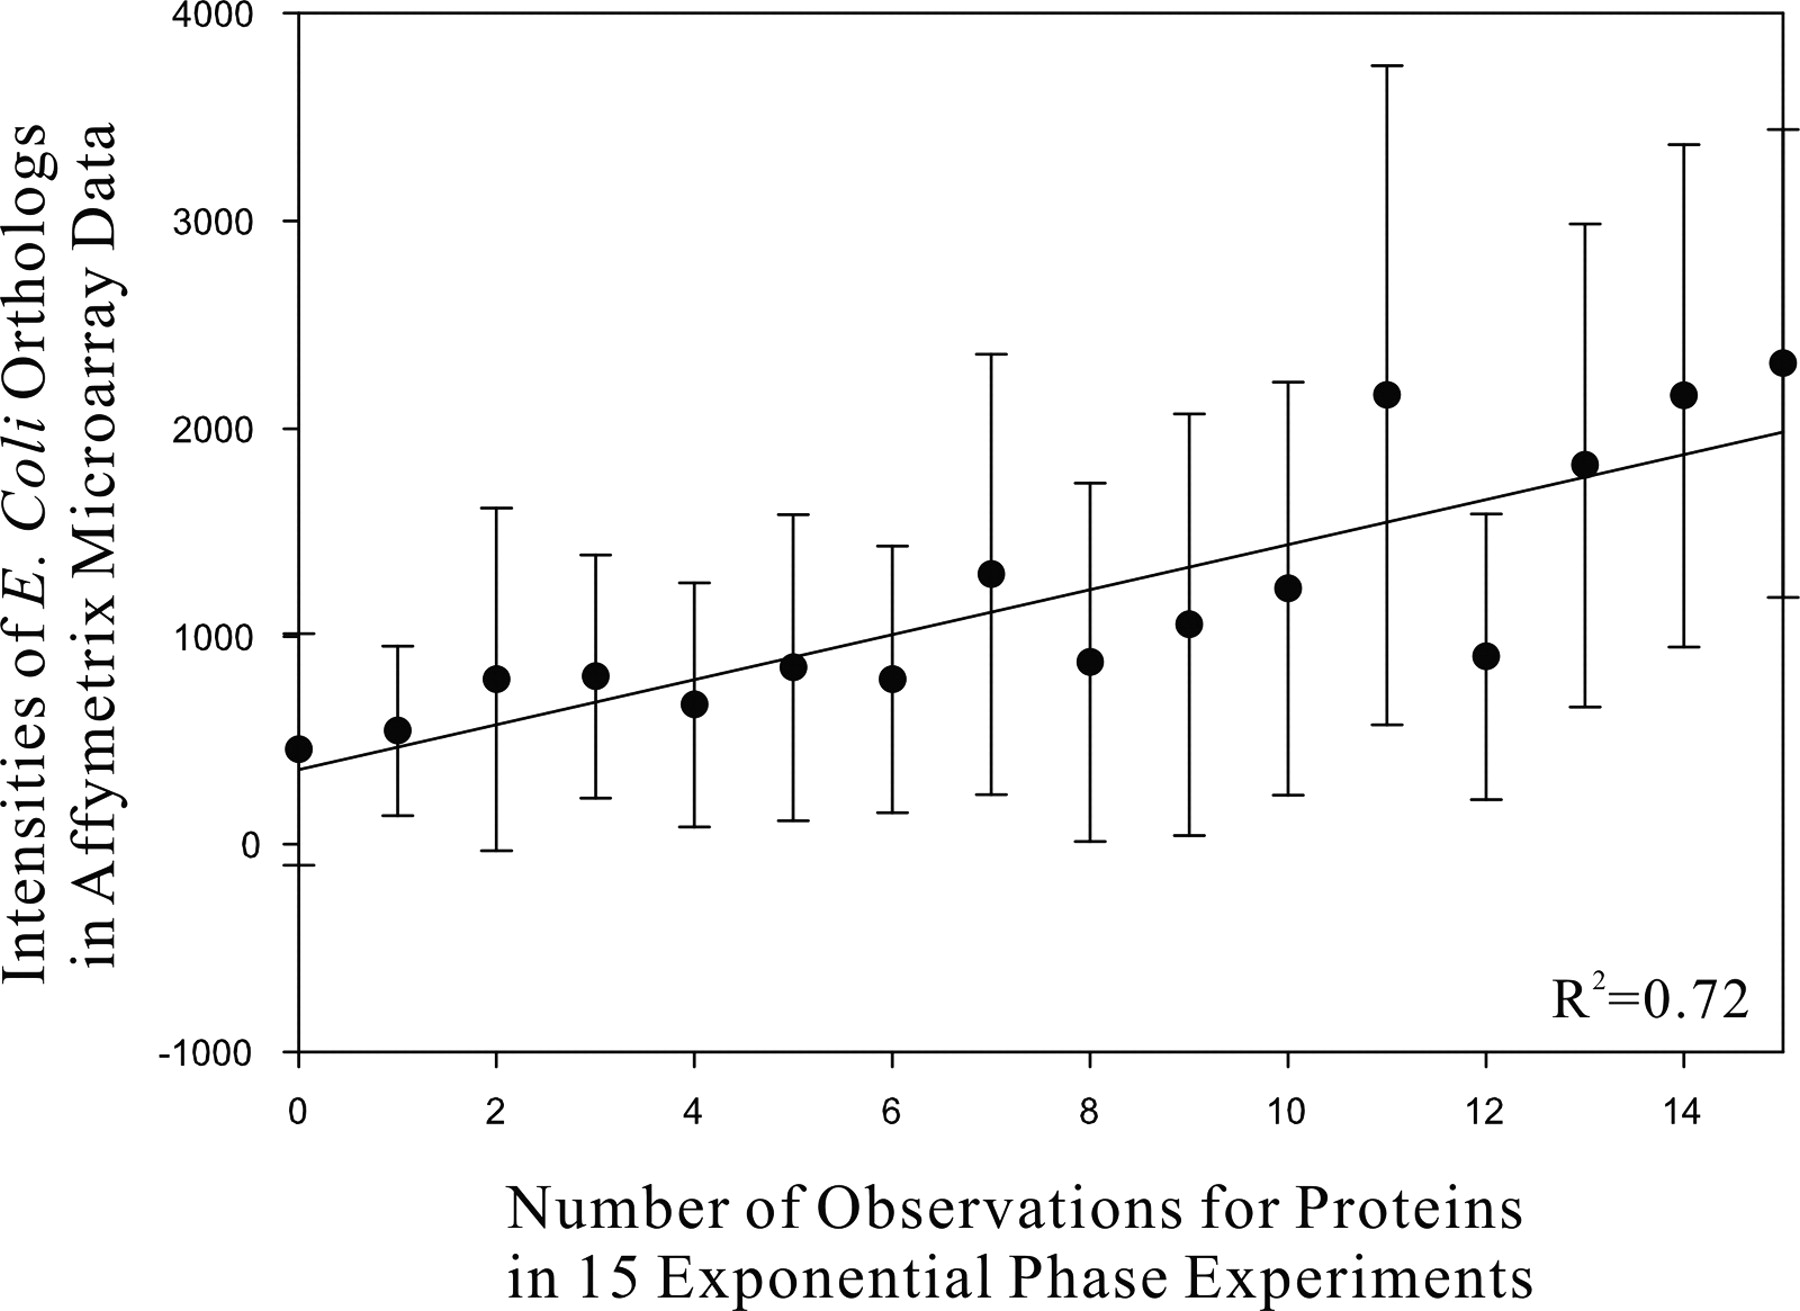
Figure 3.
The number of experiments in which each protein was observed in exponential phase correlates (R2 = 0.72) with the corresponding mRNA expression levels, estimated from E. coli orthologs' measured expression (Covert et al. 2004), suggesting that the depth of mass spectrometry sampling provides a rough estimate of protein abundance.


