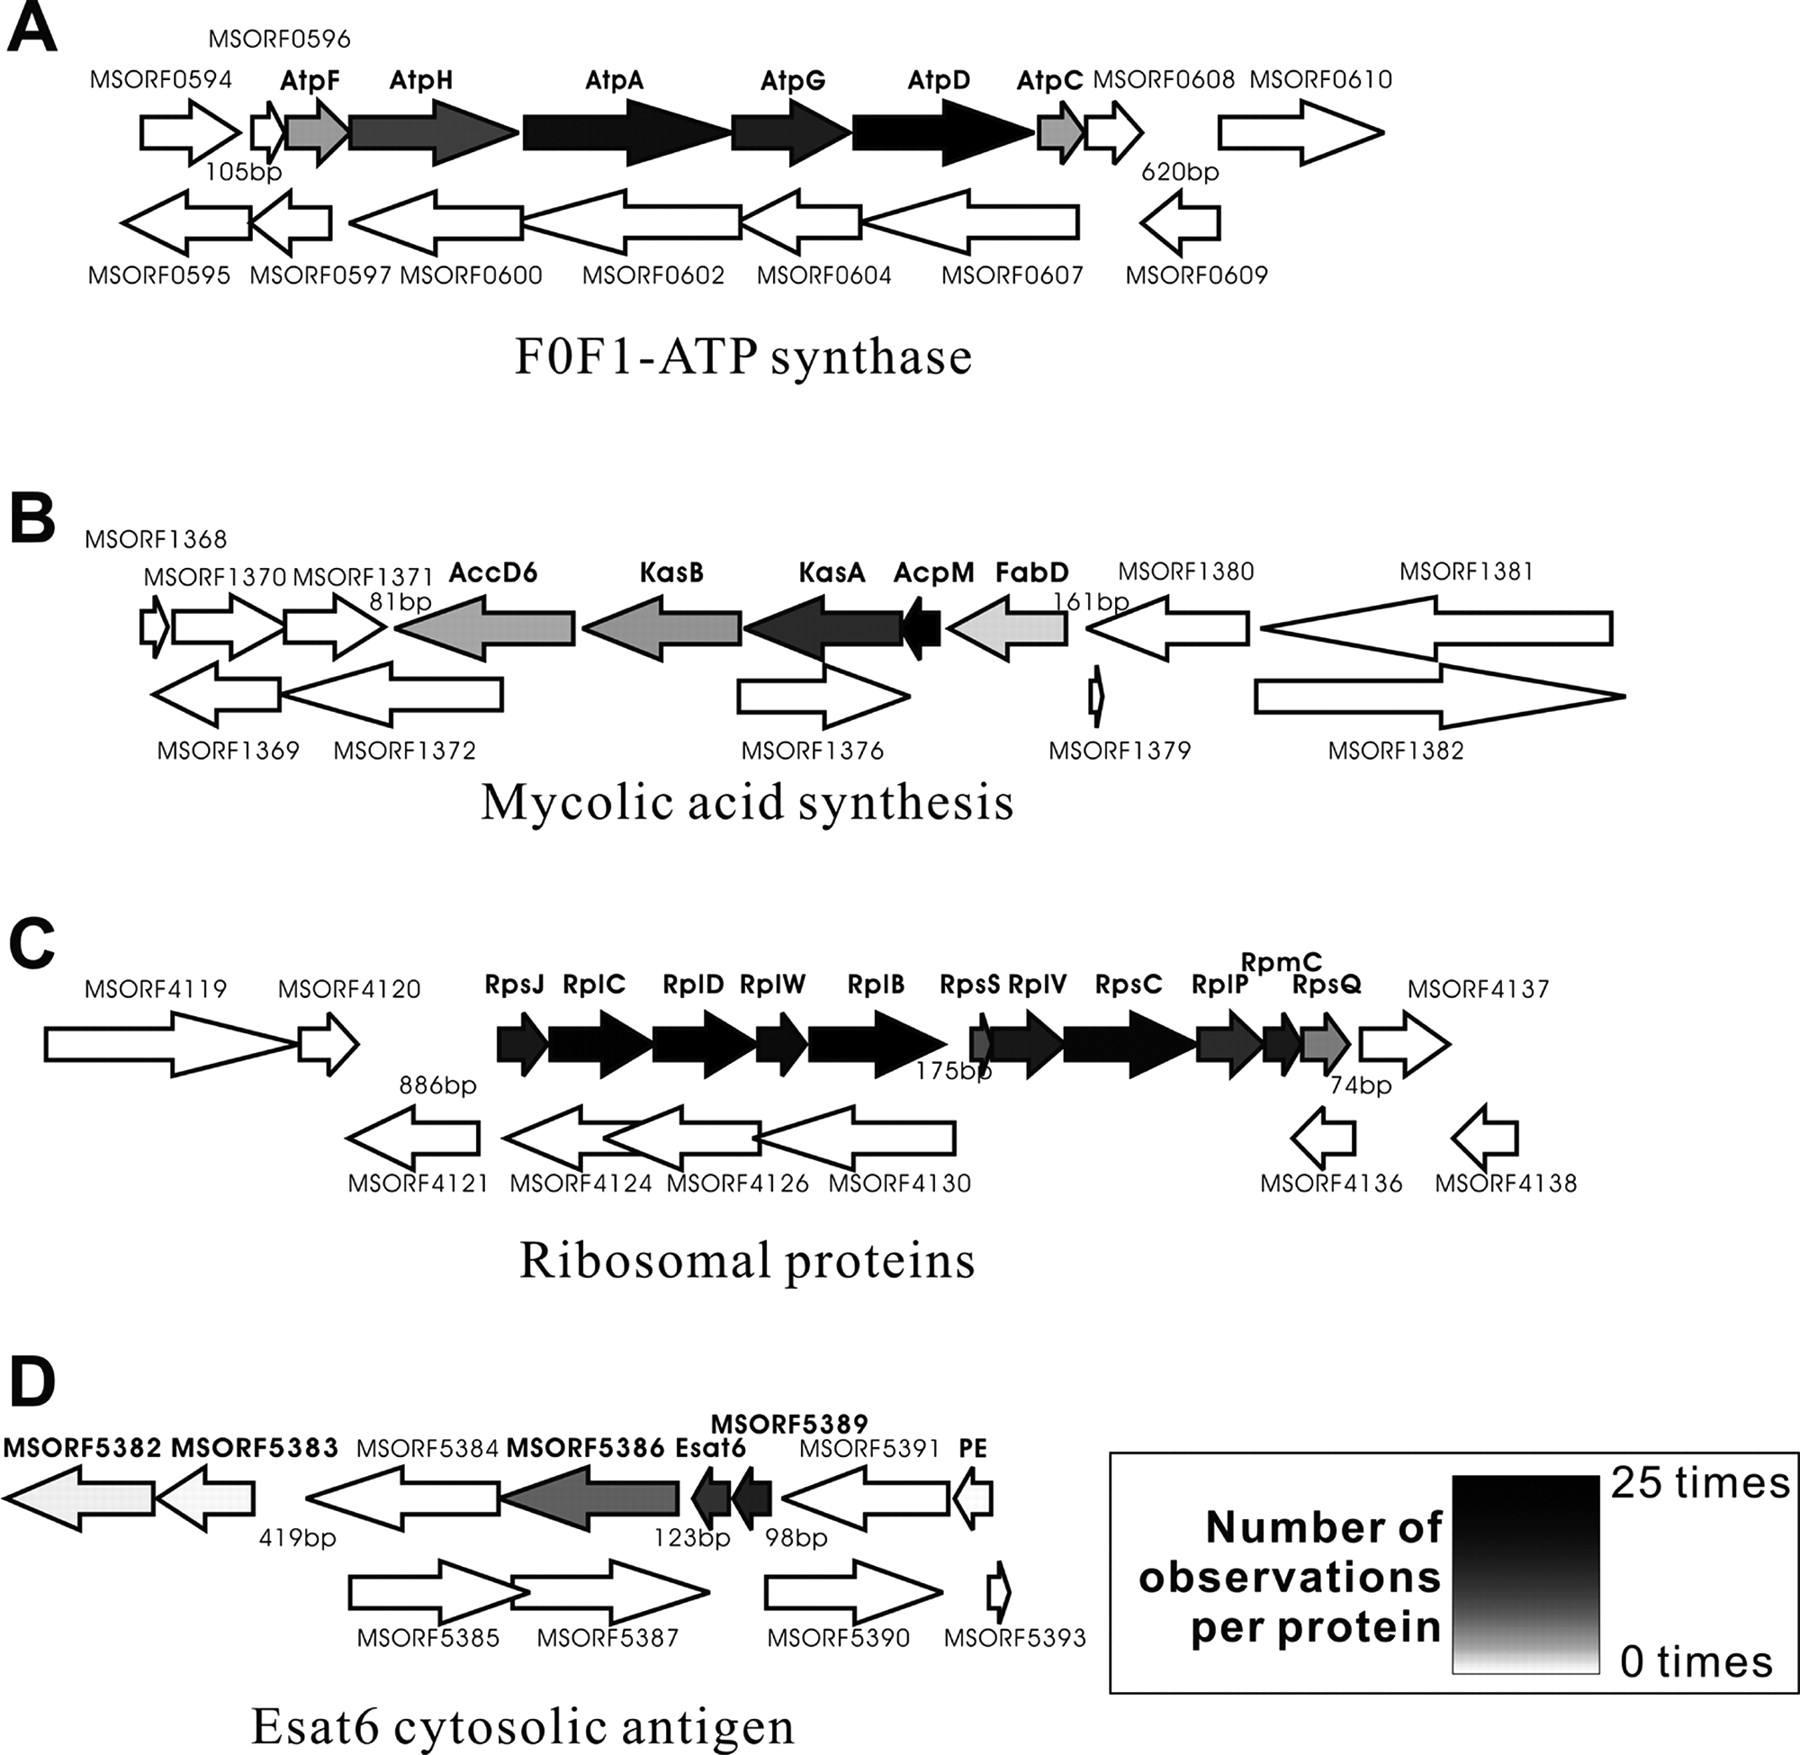
Mass spectrometry of the M. smegmatis proteome: Protein expression levels correlate with function, operons, and codon bias

(Downloading may take up to 30 seconds. If the slide opens in your browser, select File -> Save As to save it.)

Click on image to view larger version.

Figure 2.
Figure 2.

Proteins encoded in the same operon were observed to be coexpressed across the 25 experiments. All proteins observed in LC/LC/MS/MS experiments are labeled in bold, with arrows shaded according to the number of observations. Four distinct operons (A–D) are indicated.

This Article

  1. Genome Res. 15: 1118-1126

Preprint Server