
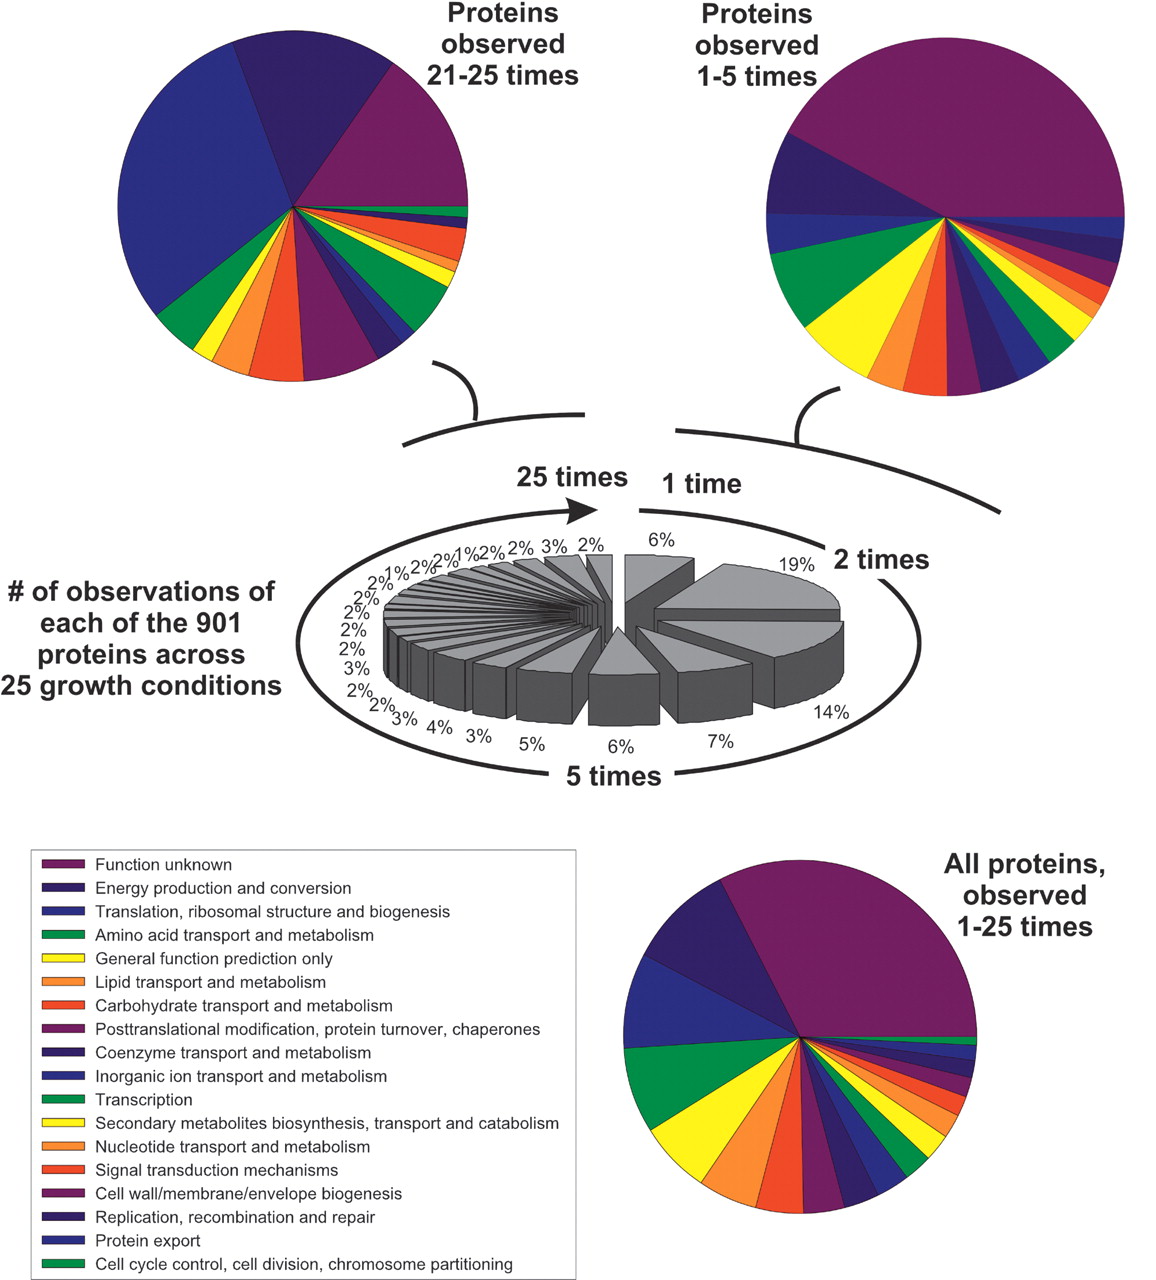
Figure 1.
The distribution of observations of each of the 901 proteins (central chart) identified across 25 LC/LC/MS/MS experiments and the associated protein functions for the complete set of proteins (bottom chart), proteins detected in only one to five of the 25 experiments (top right chart), and the high-abundance proteins detected in 20–25 of the 25 experiments (top left chart).


