
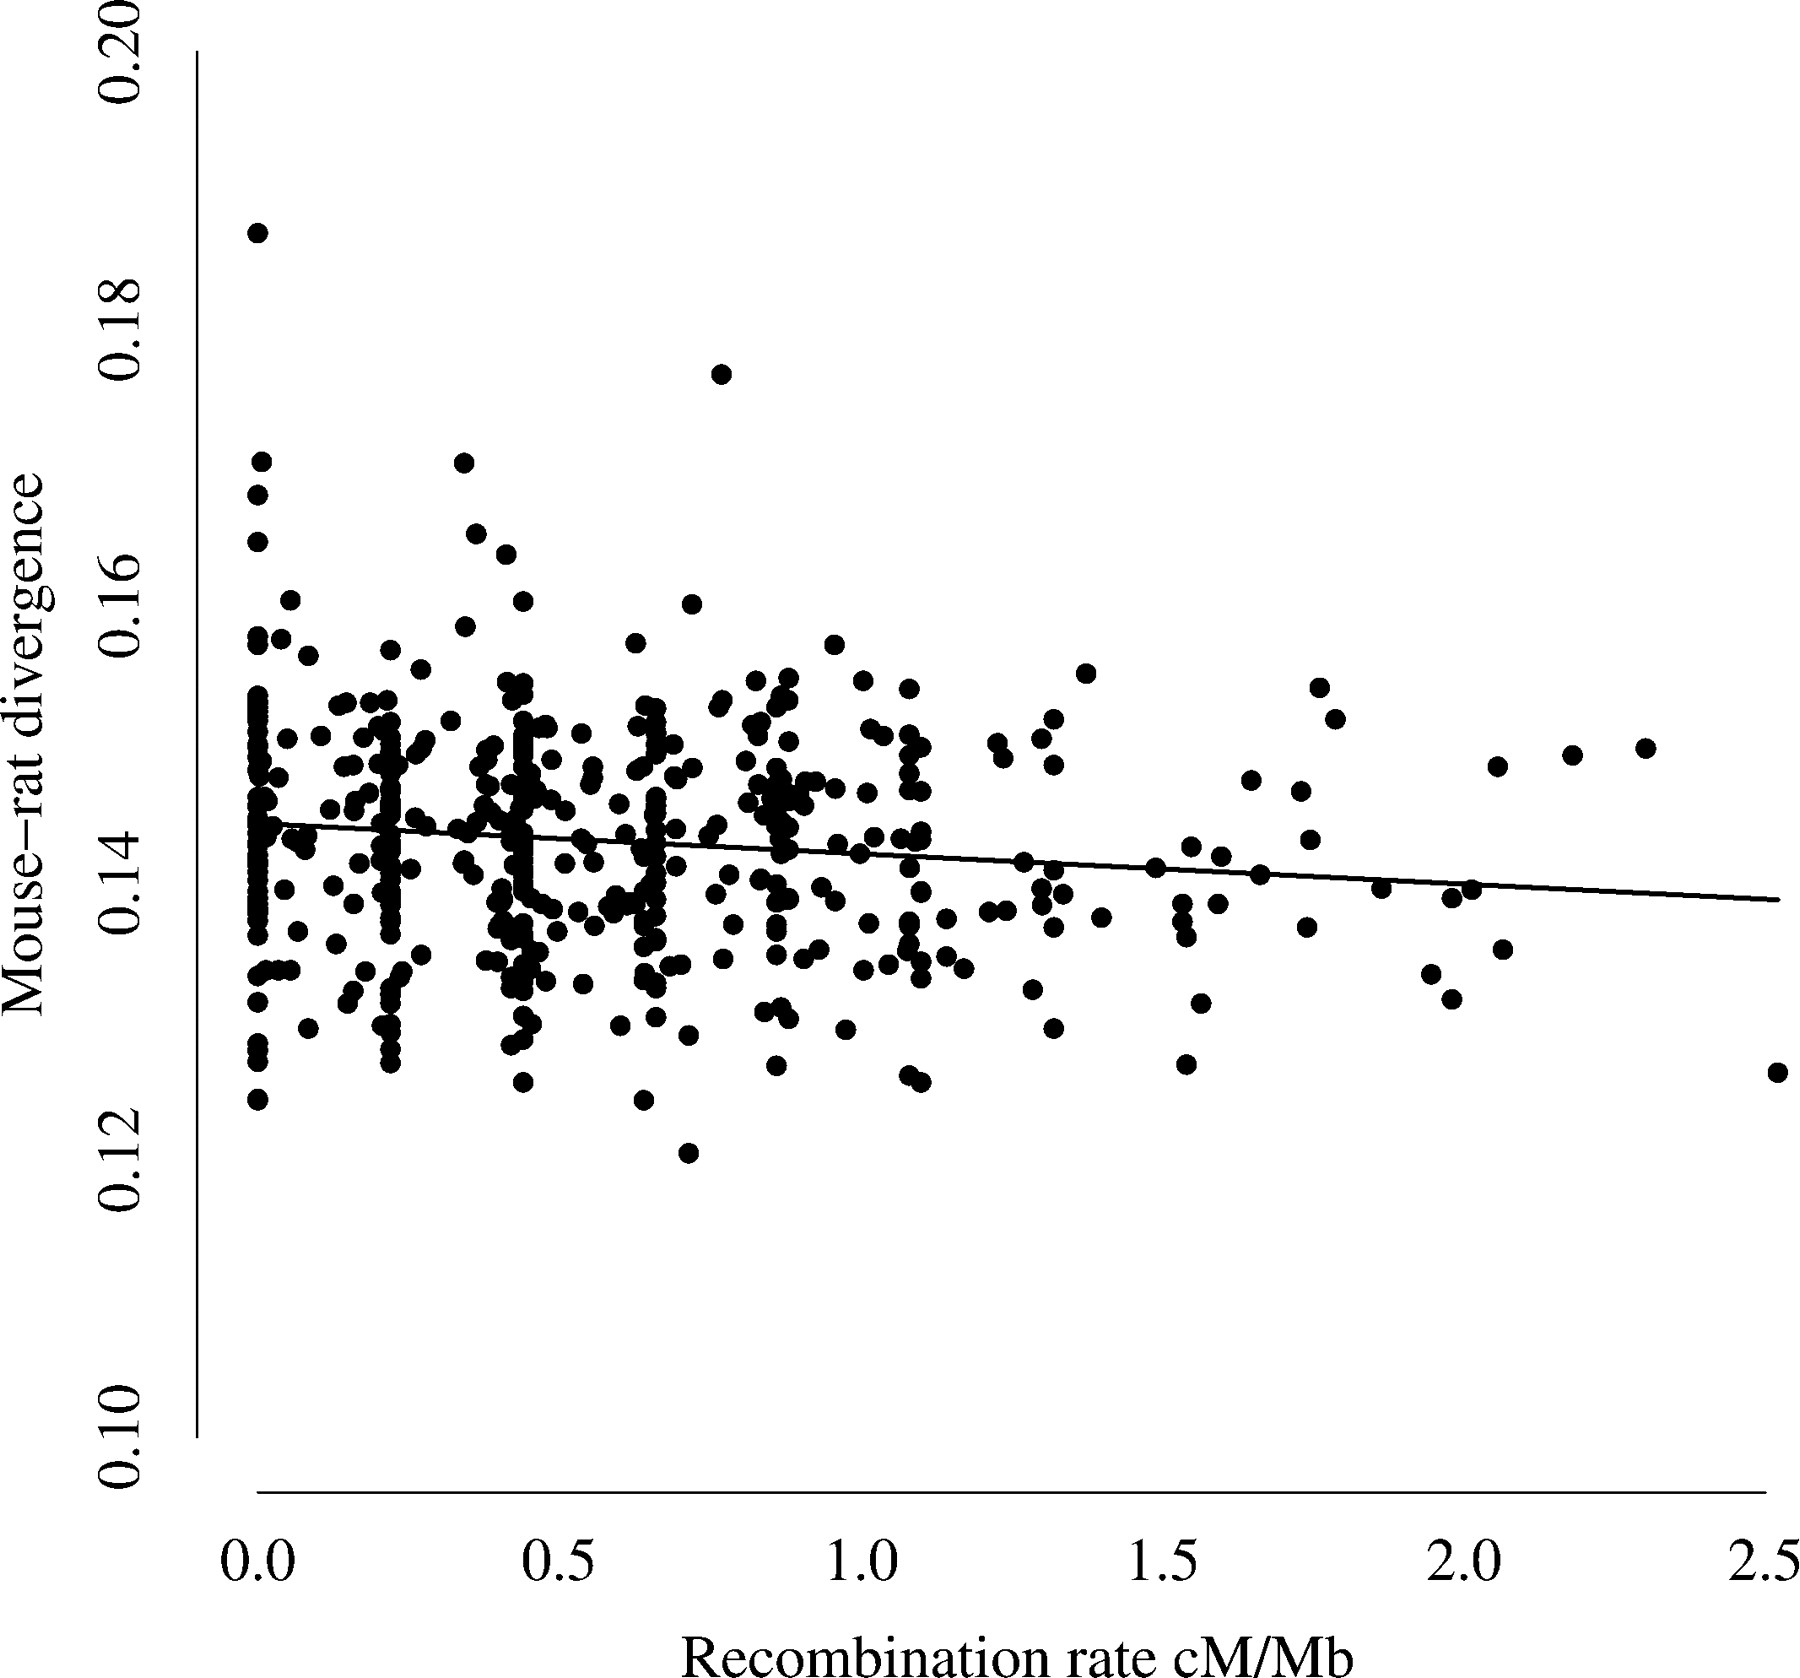
Figure 6.
The relationship between mouse–rat divergence and the mouse recombination rate average across 5-Mb windows. The equation of the regression line shown was estimated as y = 0.144 – 0.002x.
(Downloading may take up to 30 seconds. If the slide opens in your browser, select File -> Save As to save it.)
Click on image to view larger version.
The relationship between mouse–rat divergence and the mouse recombination rate average across 5-Mb windows. The equation of the regression line shown was estimated as y = 0.144 – 0.002x.
 CiteULike
 Delicious
 Digg
Digg Facebook
 Google+
 Reddit
 Twitter
