
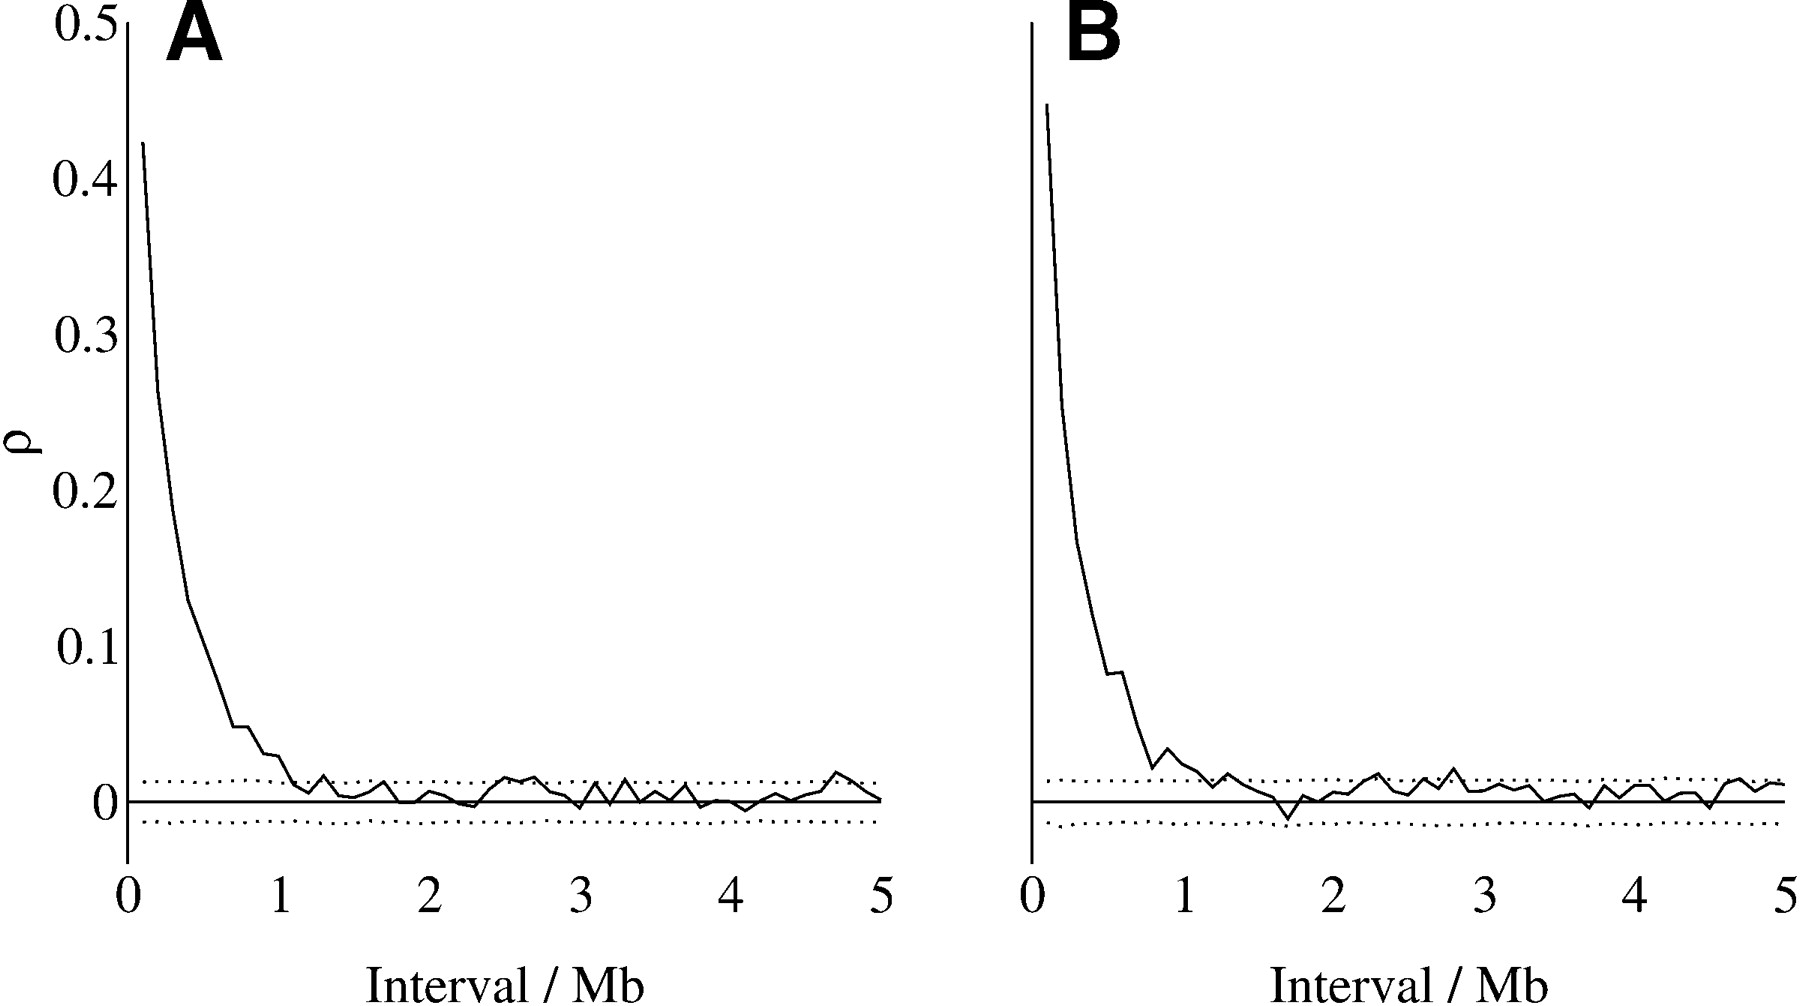
Figure 4.
Partial autocorrelation of nucleotide substitution rates in ancestral repeats (A) and flanking sequences (B). Substitution rates are estimated for all sites. Dotted lines show the upper and lower bounds of the 95% confidence interval of partial autocorrelation under the null hypothesis of no dependence of rates between blocks.


