
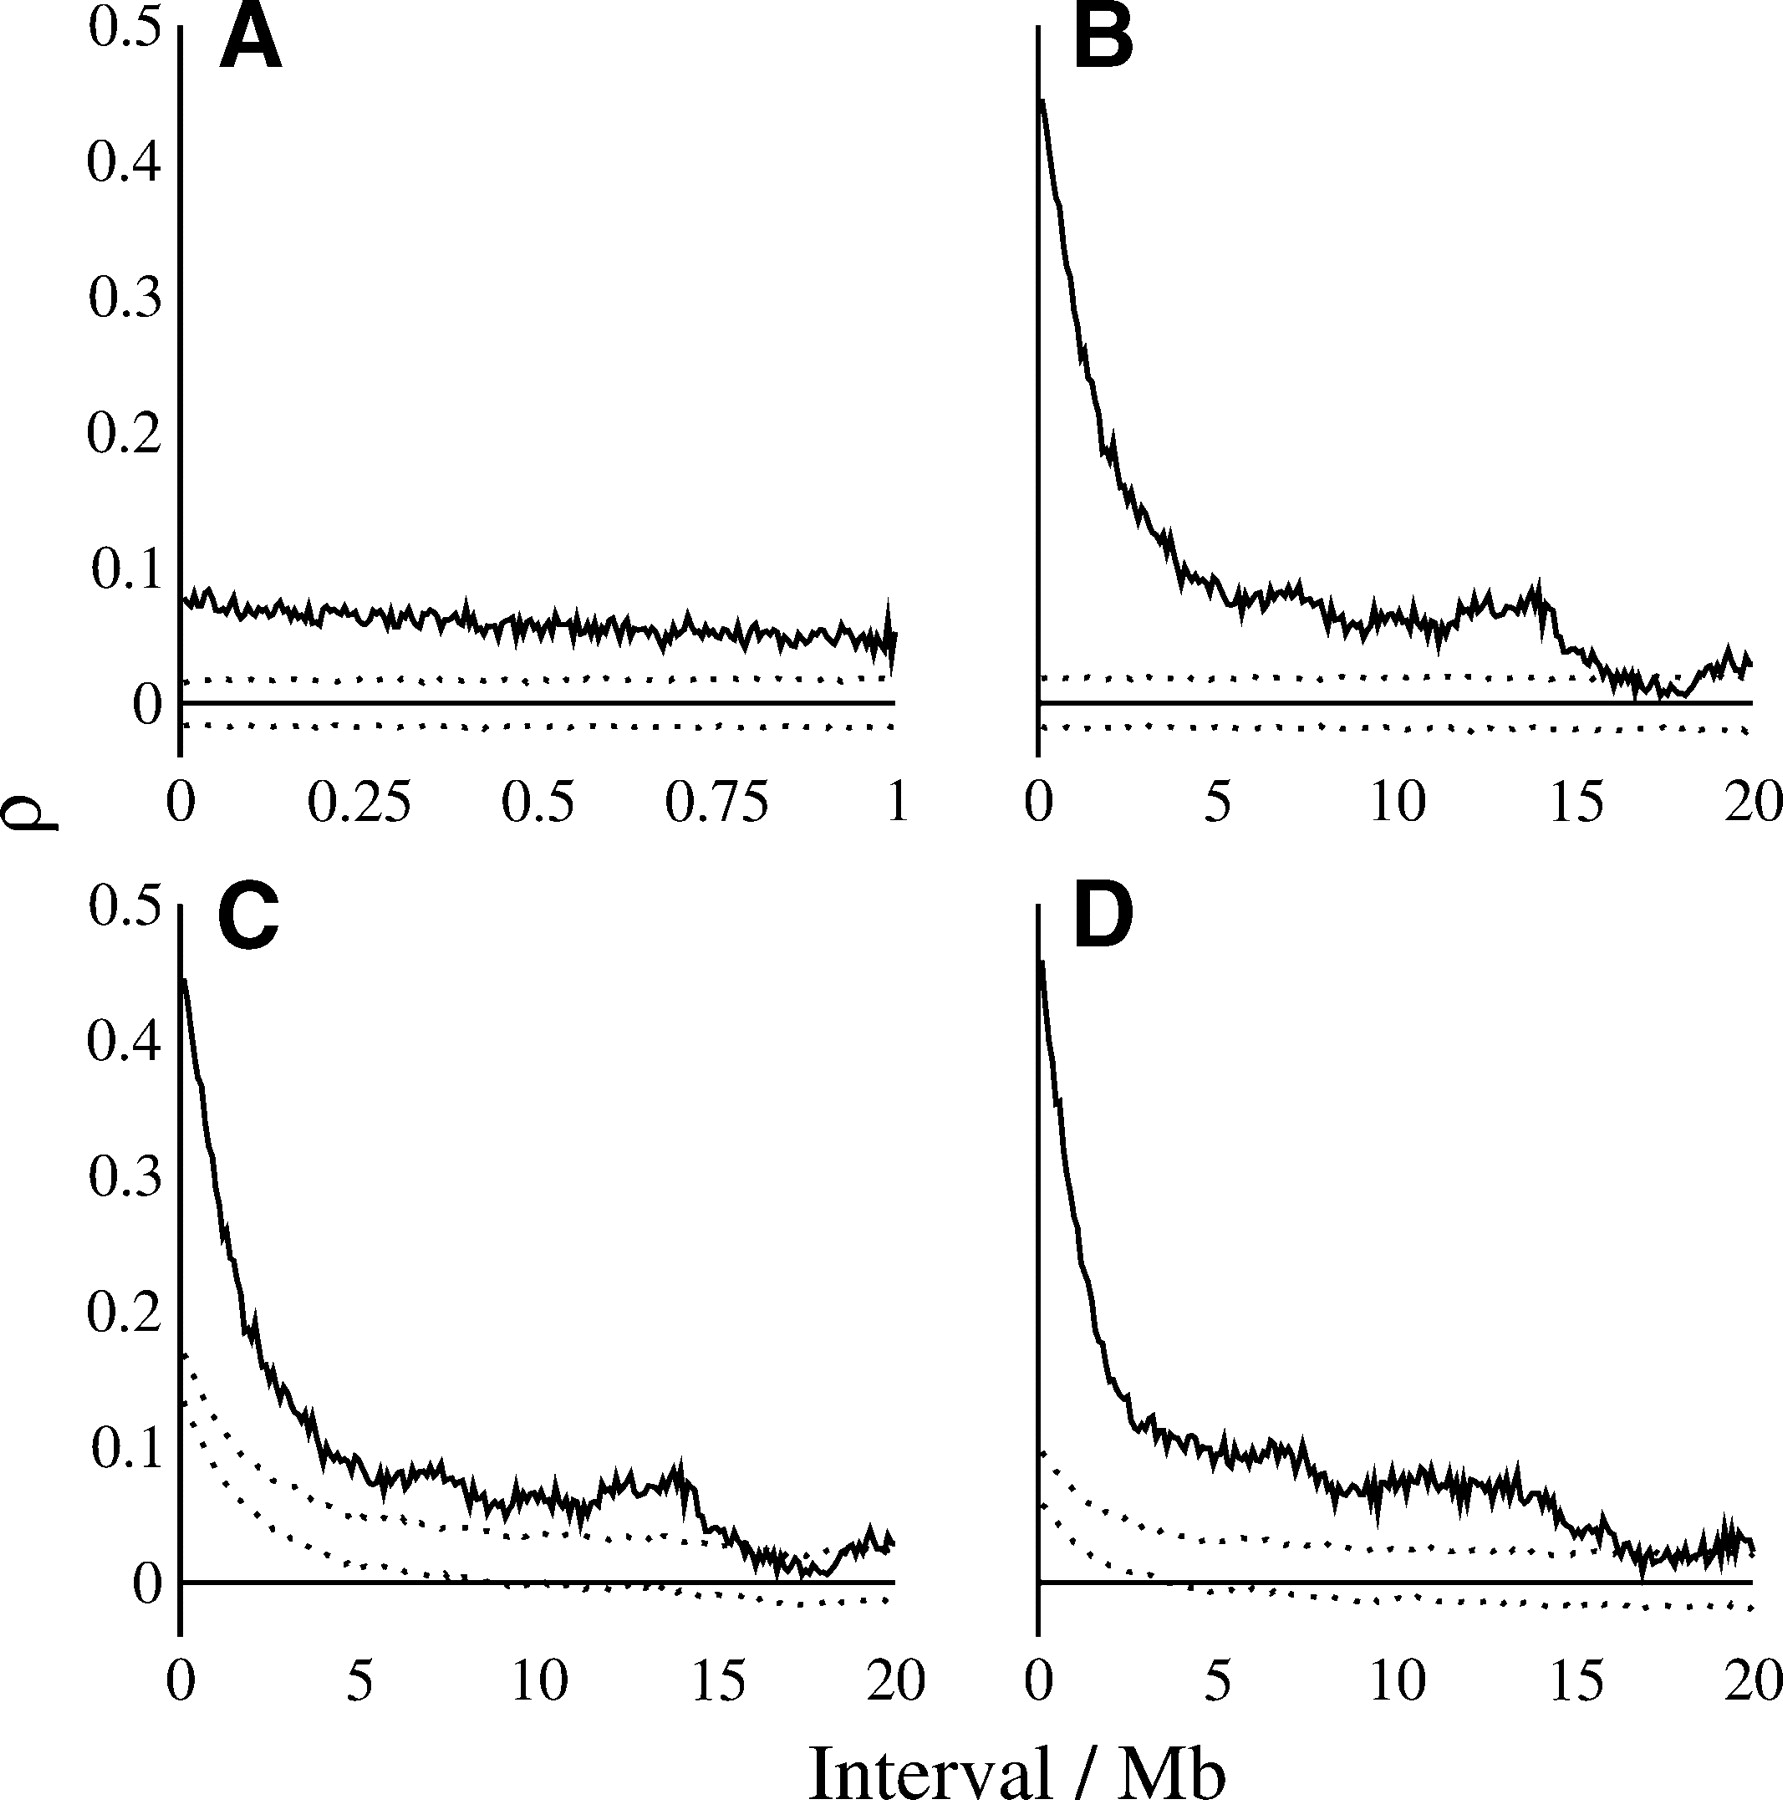
Figure 3.
Autocorrelation of nucleotide substitution rates in ancestral repeats (A,B,C) and ancestral repeat flanking sequence (D) across 5-kb (A) and 100-kb (B,C,D) blocks. Substitution rates were estimated at all sites. Dotted lines show the upper and lower bounds of the 95% confidence interval of autocorrelation under the null hypothesis of no dependence of rates between blocks. Blocks were permuted randomly (A,B) and within common GC-content intervals (C,D).


