
Figure 2.
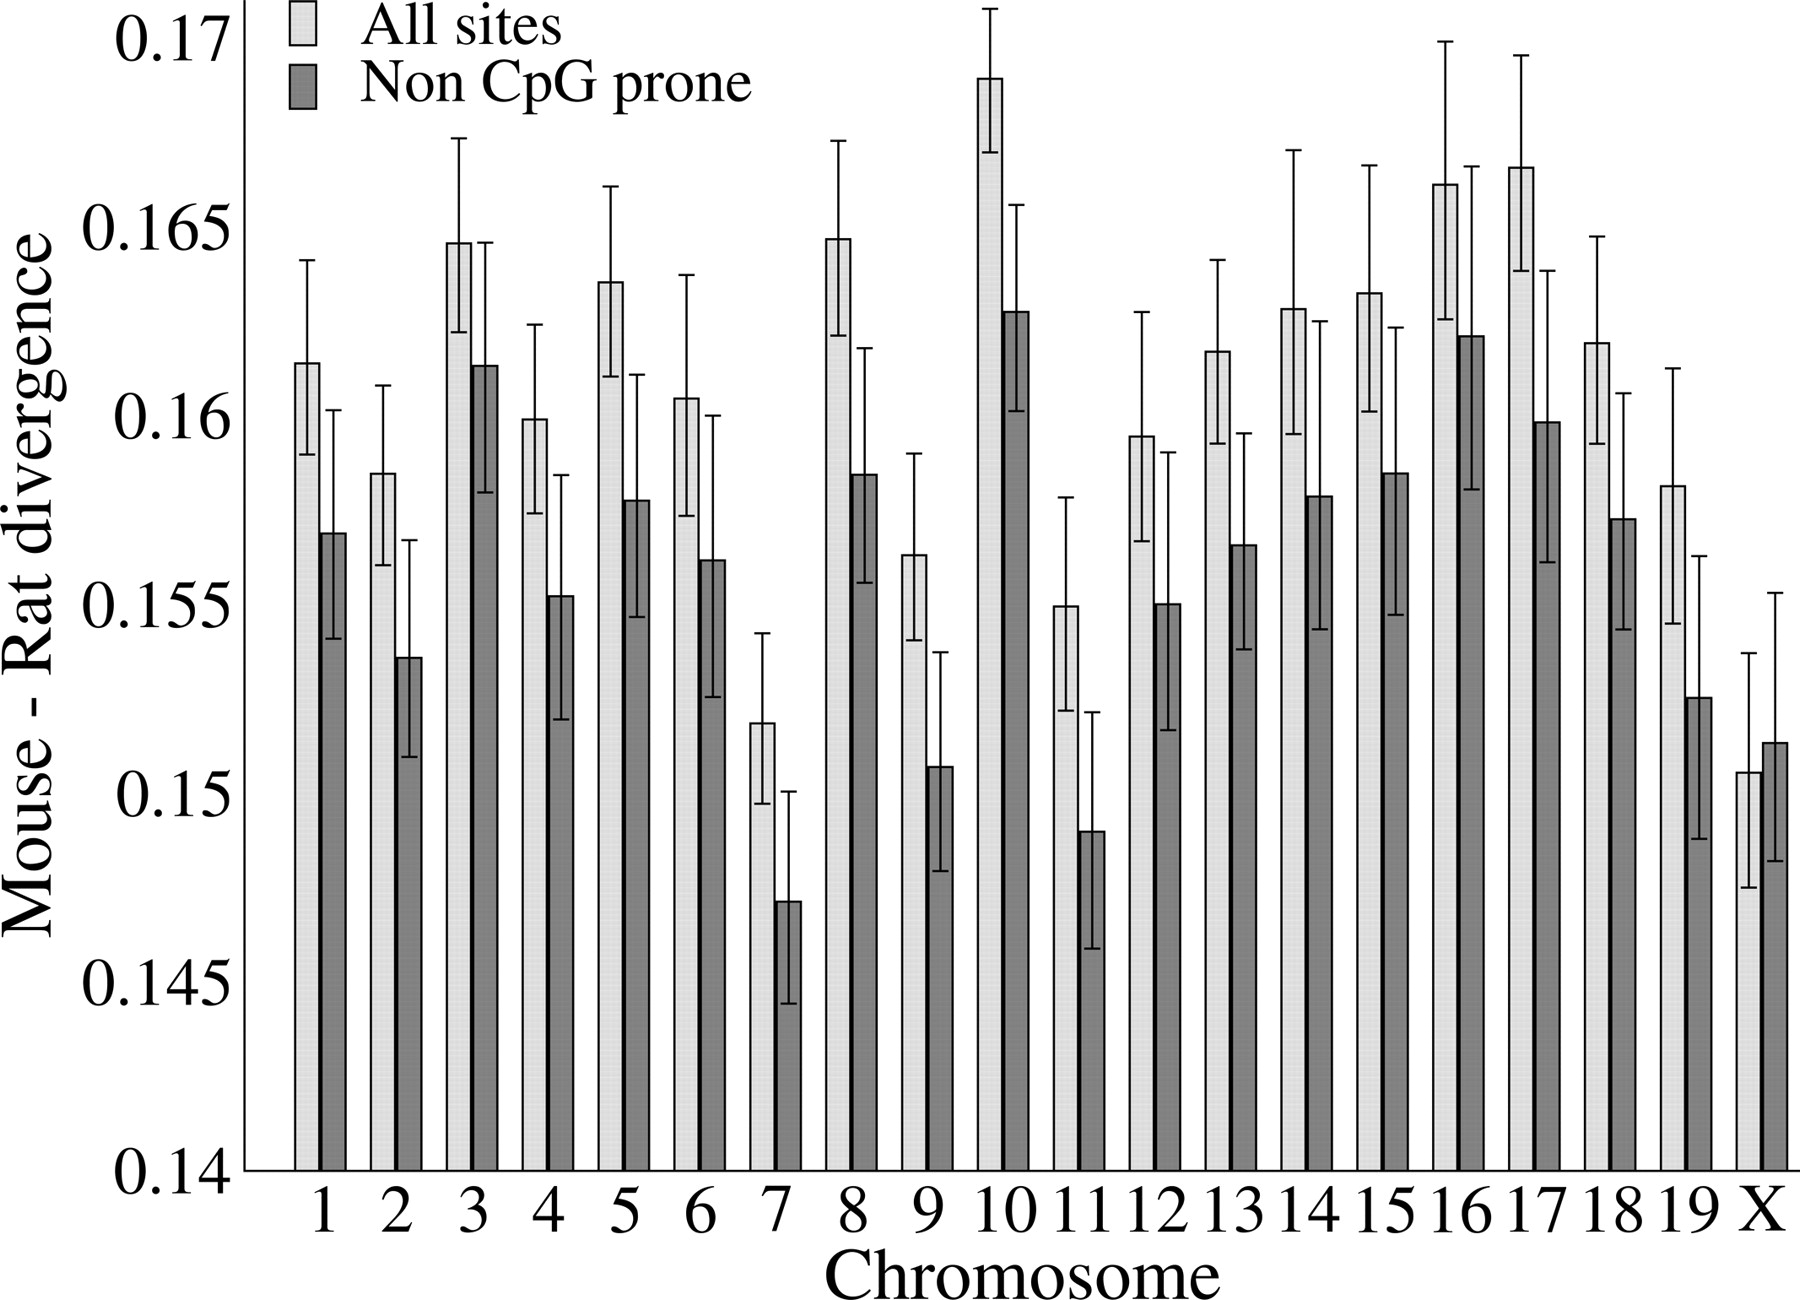
Estimated average nucleotide substitution rates at all sites and non-CpG-prone sites for each mouse chromosome. Bars show the 95% bootstrap confidence intervals.
(Downloading may take up to 30 seconds. If the slide opens in your browser, select File -> Save As to save it.)
Click on image to view larger version.
Estimated average nucleotide substitution rates at all sites and non-CpG-prone sites for each mouse chromosome. Bars show the 95% bootstrap confidence intervals.
 CiteULike
 Delicious
 Digg
Digg Facebook
 Google+
 Reddit
 Twitter
