
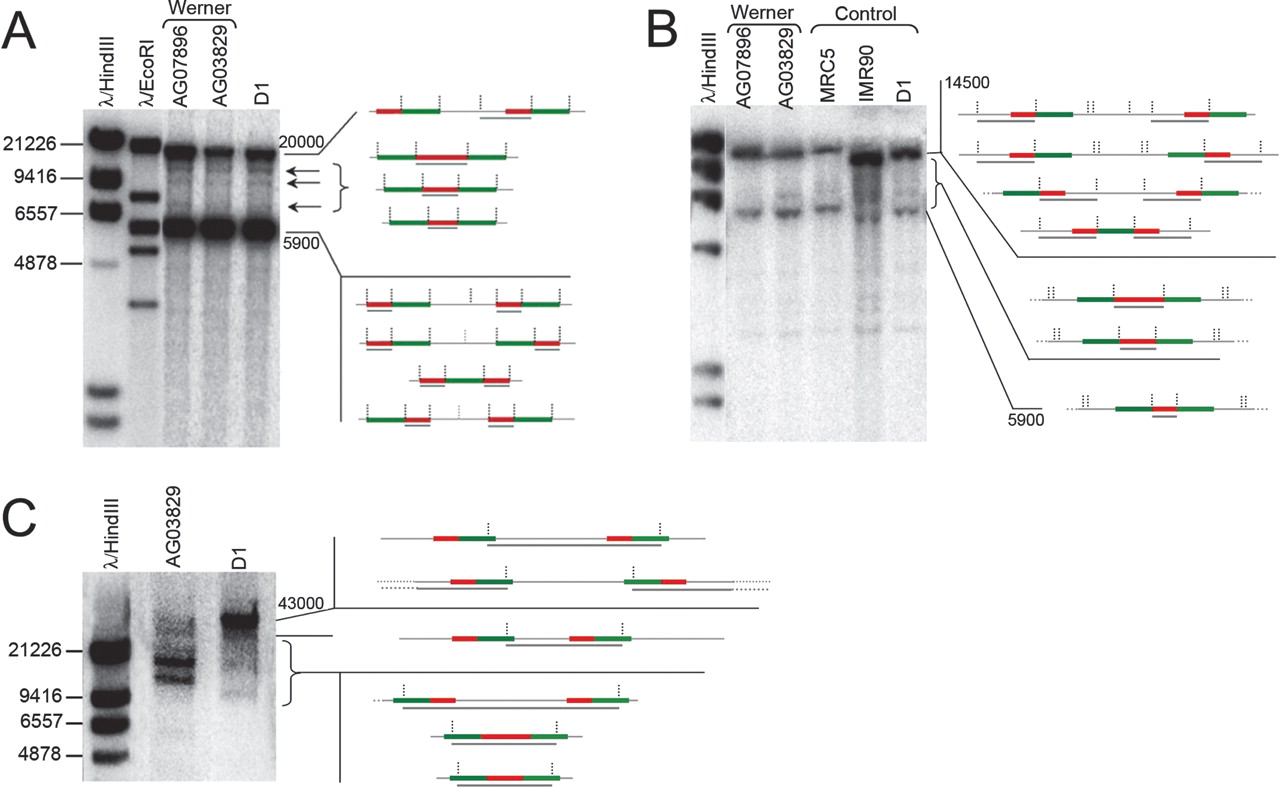
Southern blotting of human DNA hybridized with the 5.9-kb probe (fragment B, Fig. 1). DNA was extracted from a control (D1) and two Werner (AG03829 and AG07896) cell lines, in addition to two primary fetal cells (IMR90 and MRC5). (A) EcoRI digestion. The two major expected bands are apparent, at 5.9 and 20 kb, after a complete and partial enzymatic digestion due to a polymorphism of an EcoRI site (Wellauer and Dawid 1979). The arrows indicate the supplemental bands. On the right of the gels, a schematic representation presents the genomic structures that can account for the different bands after EcoRI digestion. Red lines represent the 5.9-kb probe, whereas green bars indicate the 7.1-kb probe (Fig. 1), black bars correspond to the DNA fiber. Gray bars show the regions recognized by the radioactive probe. Vertical black dotted lines show the restriction sites. The vertical gray dotted lines signify a position of digestion that can be lost after the rearrangement. (B) HindIII digestion. The band at ∼14.5 kb is expected from the digestion of canonical units (at the top of the scheme). Additional bands are visible, between 5.9 and 14.5 kb. The scheme on the right shows the noncanonical units that could generate those bands upon HindIII digestion. (C) I-PpoI digestion, run on a PFEG. The control and Werner sample (D1 and AG03829, respectively) show the expected band at 43 kb and several additional bands. One band of the Werner sample shows a different size, suggesting that a type of rearrangement is more represented in this cell type. The scheme explains the canonical and noncanonical units that could generate the supplementary bands. Numbers on the right of the gels indicate the approximate size of the bands, expressed in base pairs.


