
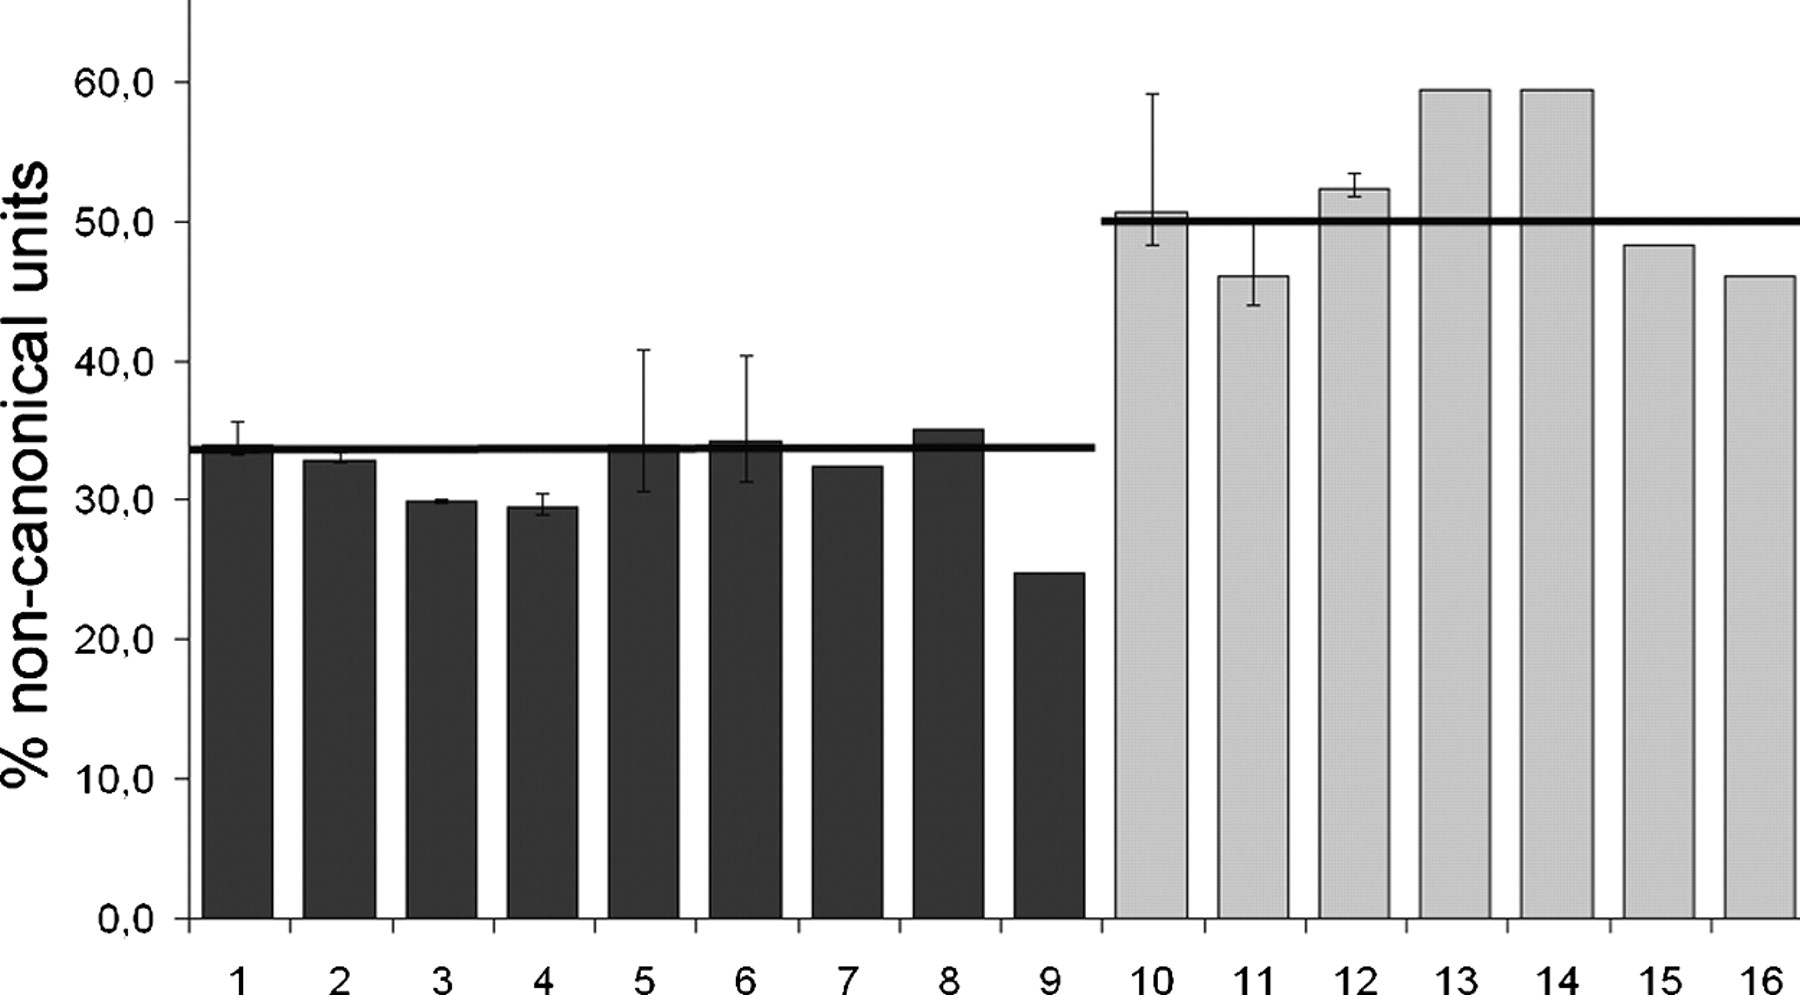
Noncanonical units in human cell lines. A bar chart showing the total percentage of noncanonical rDNA units in control cell lines in dark gray (with the total number of counted rDNA units for each cell line in parenthesis): (1) AG12657 (1948); (2) AG11561 (1554); (3) AG05283 (1640); (4) AG13077 (1549); (5) AG07898 (998); (6) AG07897 (2522); (7) D1; (8) MRCV (3649); (9) IMR90 (6357); and in Werner syndrome cell lines in light gray: (10) AG07896 (1269); (11) AG03141 (2421); (12) AG03829 (2206); (13) AG12797 (1275); (14) AG06300 (1275); (15) AG11395 (1381); (16) WV1 (1003). Horizontal bars are set at the average percentage for control and WS cells. Error bars are shown for the mean of three experiments; the other values are each the mean of two experiments.


