
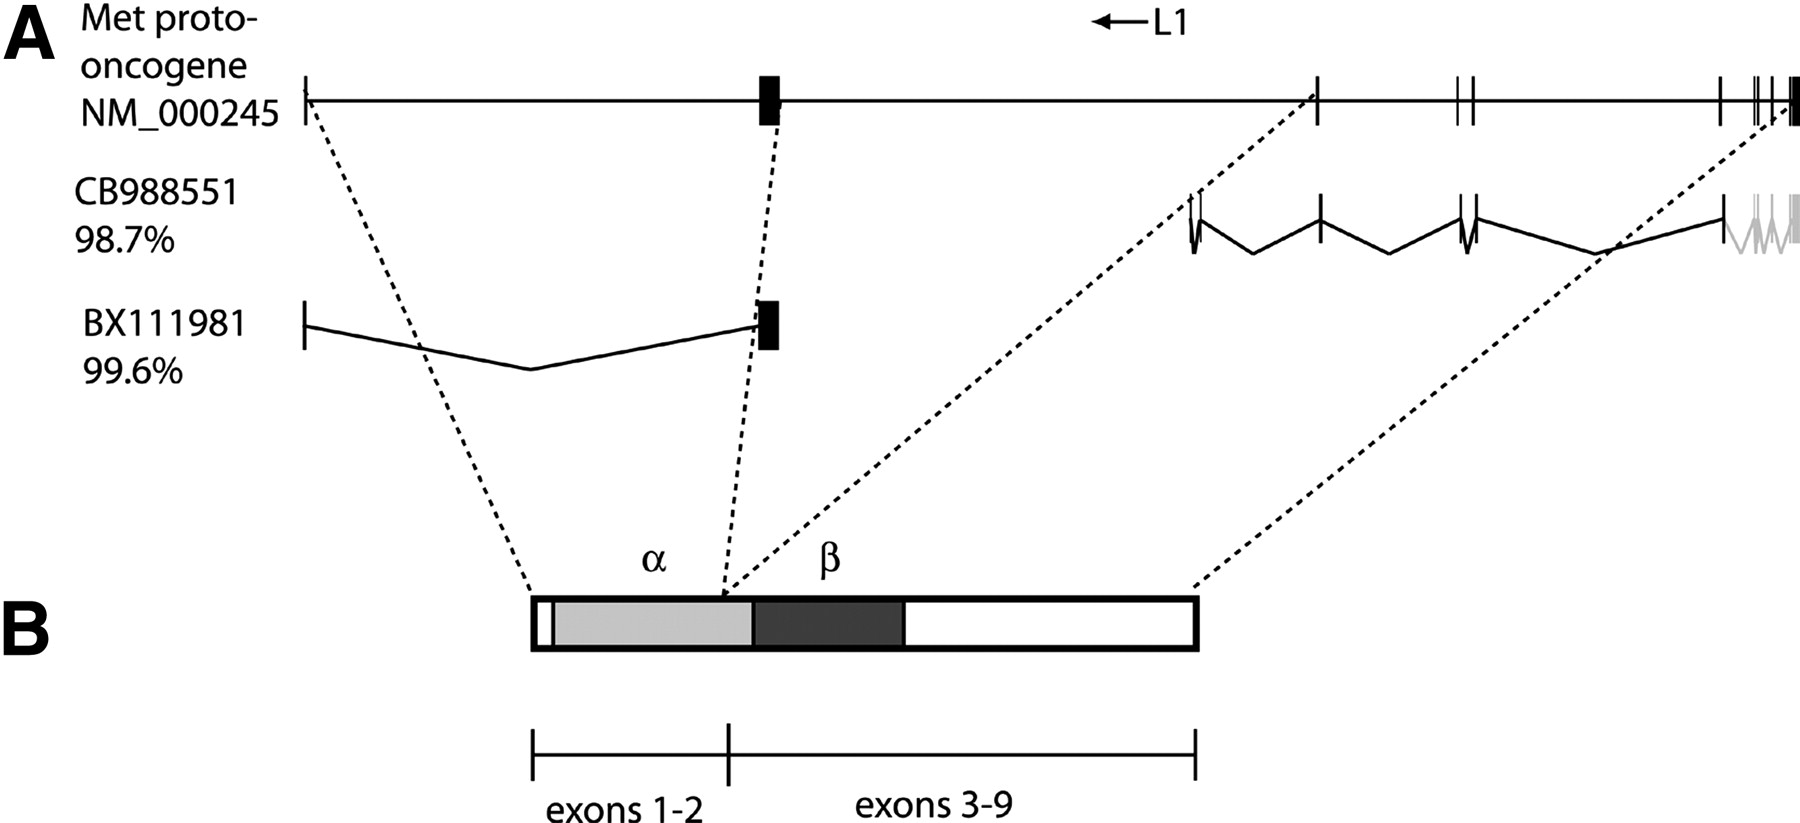
Figure 5.
(A) The MET gene, showing the location of the L1 element as well as the 5′ and L1-promoted ESTs. (B) The MET gene product, showing the cleavage point between the α and β subunits as well as the mapping of the gene's exons onto the protein product.


