
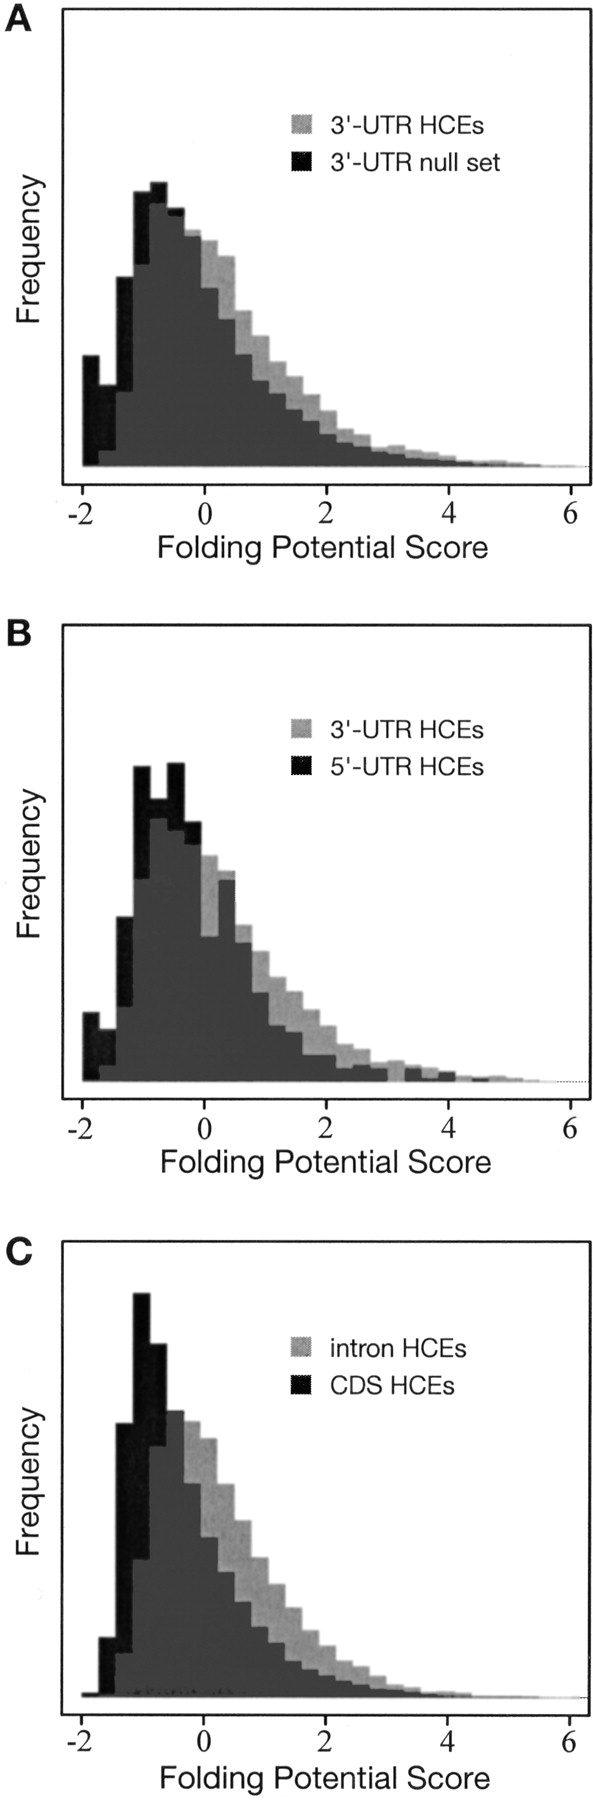
Figure 6.
Histograms of folding potential scores (FPSs) for (A) highly conserved elements (HCEs) in 3′ UTRs vs. a random sample of 3′ UTRs without HCEs, (B) HCEs in 3′ UTRs vs. HCEs in 5′ UTRs, and (C) HCEs in introns vs. HCEs in coding regions (vertebrate data in all cases). Scores are based on a phylogenetic stochastic context-free grammar, and represent the potential for local secondary structure in a sliding window of 150 bp (see Methods). In all three cases, the difference between the distributions is highly statistically significant (P = 8.8 e-66, P = 1.1 e-8, and P = 4.4 e-215, respectively; Wilcoxon rank sum test).


