
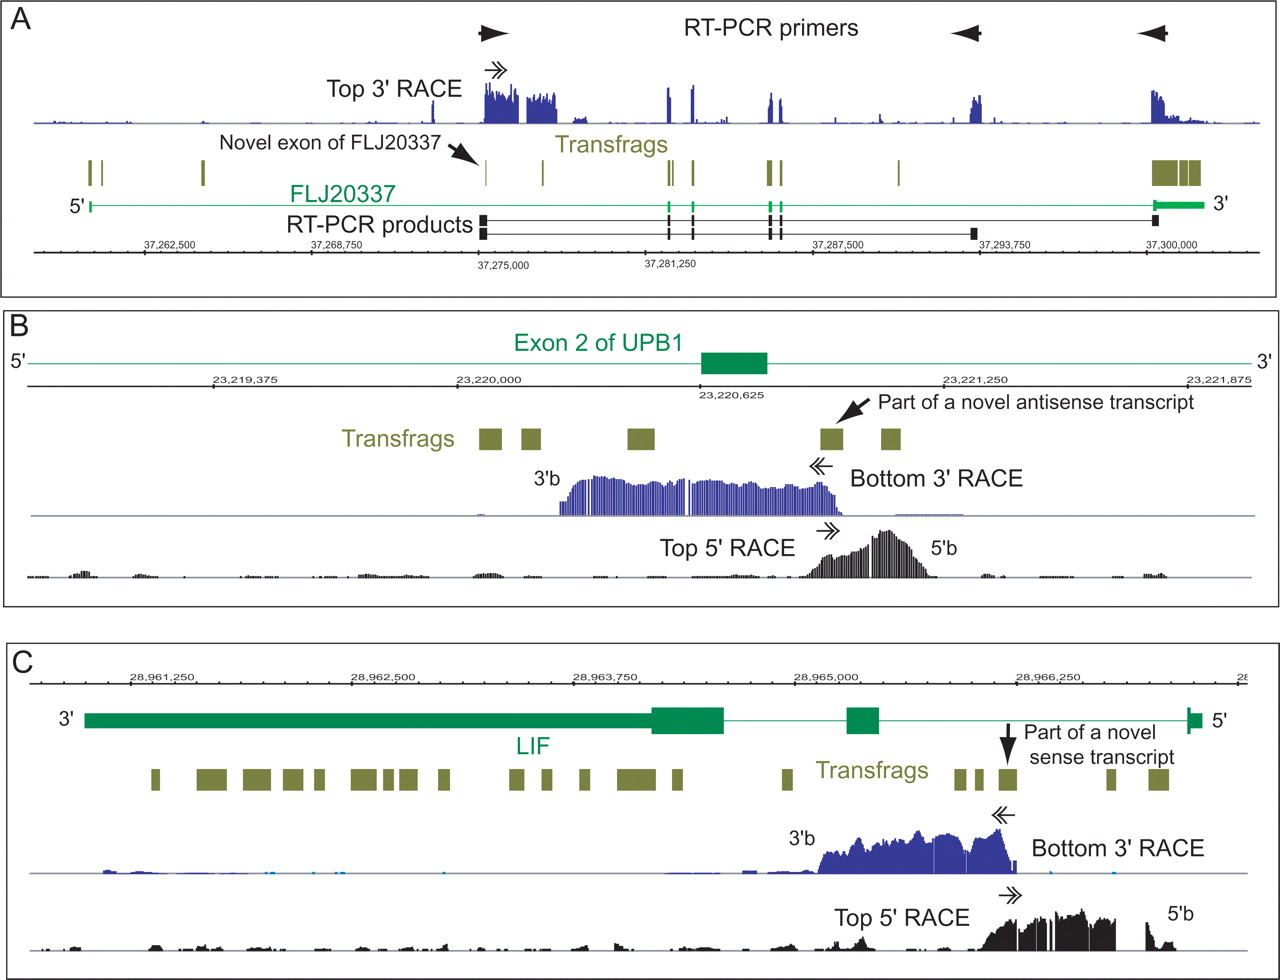
Different classes of novel intronic transfrags revealed by RACE/array. (A) A novel transfrag (shown by an arrow) within RIKEN cDNA FLJ20337 (top strand, Chromosome 6) represents a novel exon of this gene, as evidenced by the 3′-RACE/array profile and sequences of two different RT-PCR products. (B) Several novel intronic transfrags represent a bottom-strand transcript antisense to the UPB1 gene (top strand, Chromosome 22), as evidenced by 5′- and 3′-RACE/array analyses. (C) Intronic transfrags within the LIF gene (bottom strand, Chromosome 22) represent internal sense transcripts as evidenced by 5′- and 3′-RACE/array analysis. Approximate positions of the 5′- and 3′-ends of the transcripts on the bottom strand in panels B and C are indicated as “5′b” and “3′b.”


