
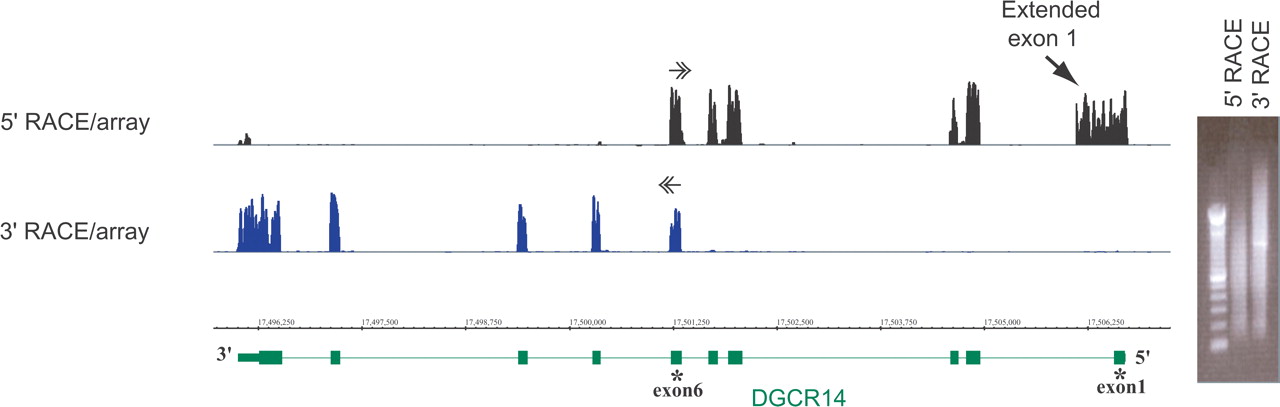
RACE/array profiling of the DGCR14 gene, located on the bottom strand of Chromosome 22. 5′- and 3′-RACE profiling with RACE primers selected at exon-exon junctions of exons 6/7 and 5/6, correspondingly. In this and the following figures, positions and directions (5′-3′) of the RACE primers are indicated by horizontal double arrows, and annotations are represented by UCSC Known Genes or RefSeqs (http://www.genome.ucsc.edu) (green). In addition, RACE/array data are always represented as graphs of signal intensities for every probe on an array. The gel image of electrophoretic profiles of the RACE reactions prior to array-hybridizations are also shown. Profiles of known exons (bottom) can be clearly discerned from the RACE/array maps.


