
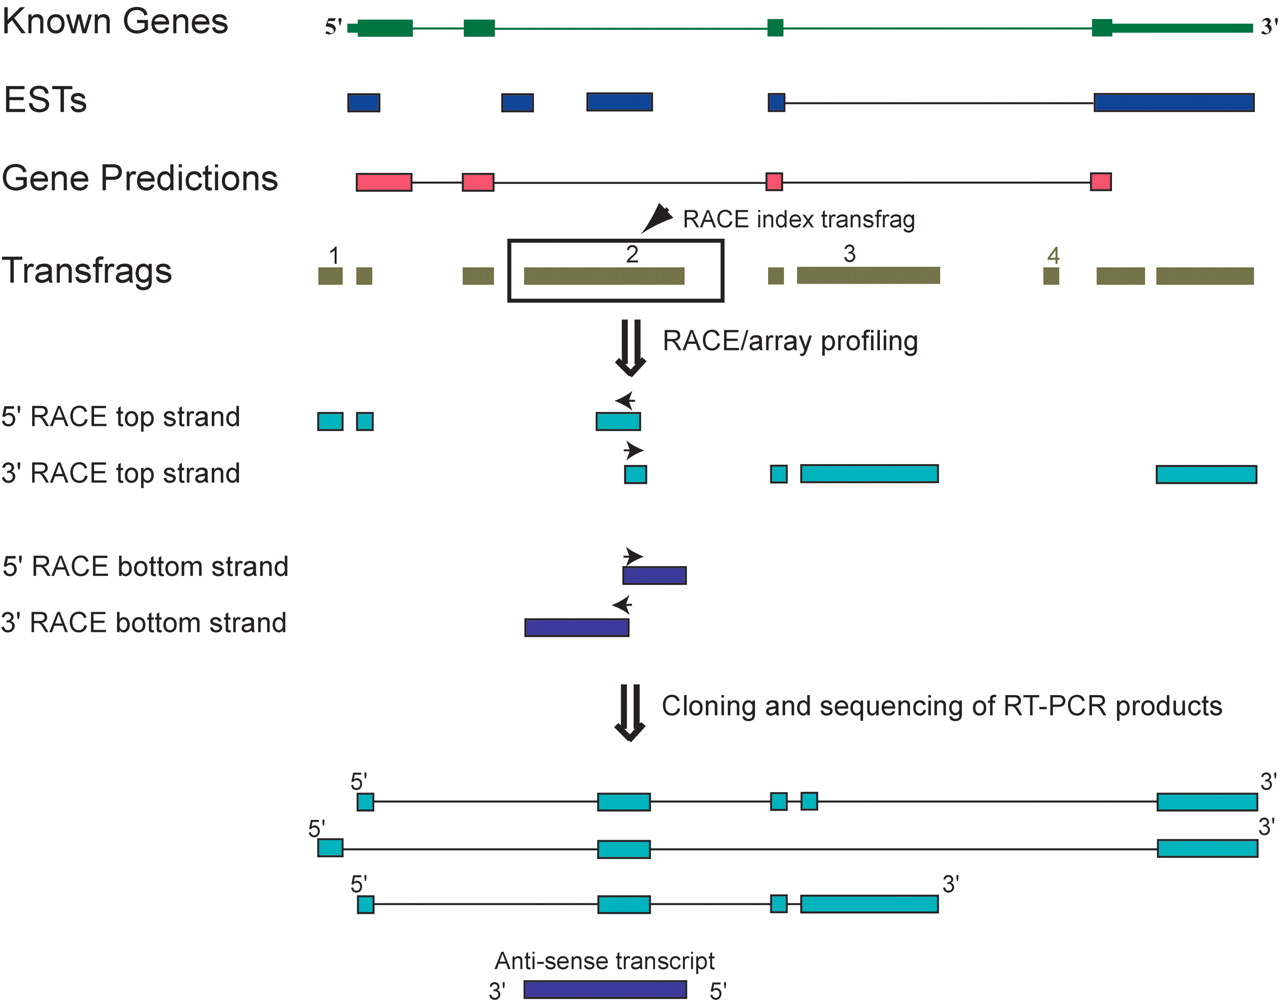
Figure 1.
A schematic representation of the transcriptome data and RACE/array workflow. An example of a locus defined by bounds of a known gene is shown together with additional existing genome annotations, such as ESTs and GenScan predictions. Exons are represented by boxes and introns by lines. Throughout all of the figures, transcriptome data derived from array profiling of cellular RNA are represented by transcribed fragments (transfrags; olive green).


