
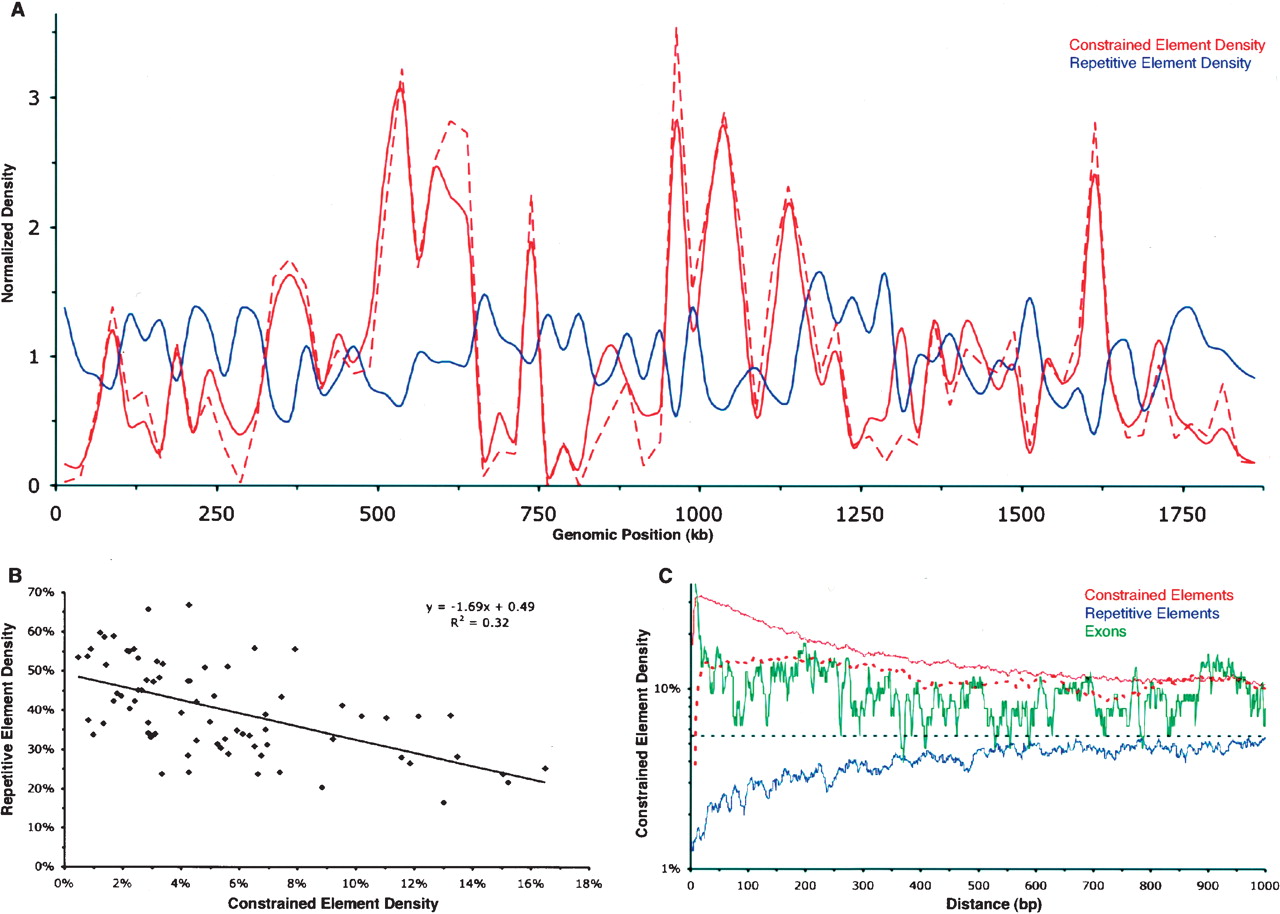
Constrained elements tend to cluster, and this clustering is inversely correlated with repetitive element density. (A) Densities of constrained elements (red) and repetitive elements (blue) along the length of the human CFTR locus. Densities are determined for consecutive, nonoverlapping 25-kb windows, and each window is normalized by the locus-wide average. The solid red line corresponds to constrained elements identified with a merging tolerance of one unconstrained column, as opposed to six unconstrained columns for the dashed line (Fig. 1A; see Methods). (B) Regional constrained element density vs. repetitive element density. The values for each 25-kb window used in A are shown. The equation and trendline correspond to a simple linear regression model relating the two variables, with an R2 value of 0.32. (C) Constrained element density as a function of distance from various features (see Methods); (solid red line) constrained elements with a merging tolerance of one unconstrained column; (dashed red line) constrained elements with a merging tolerance of six unconstrained columns; (green line) exons; (blue line) repeats. Note that the behavior of the red lines very near the origin is a result of the fact that a pair of elements cannot be within the “merge distance” of each other (see Methods).


