
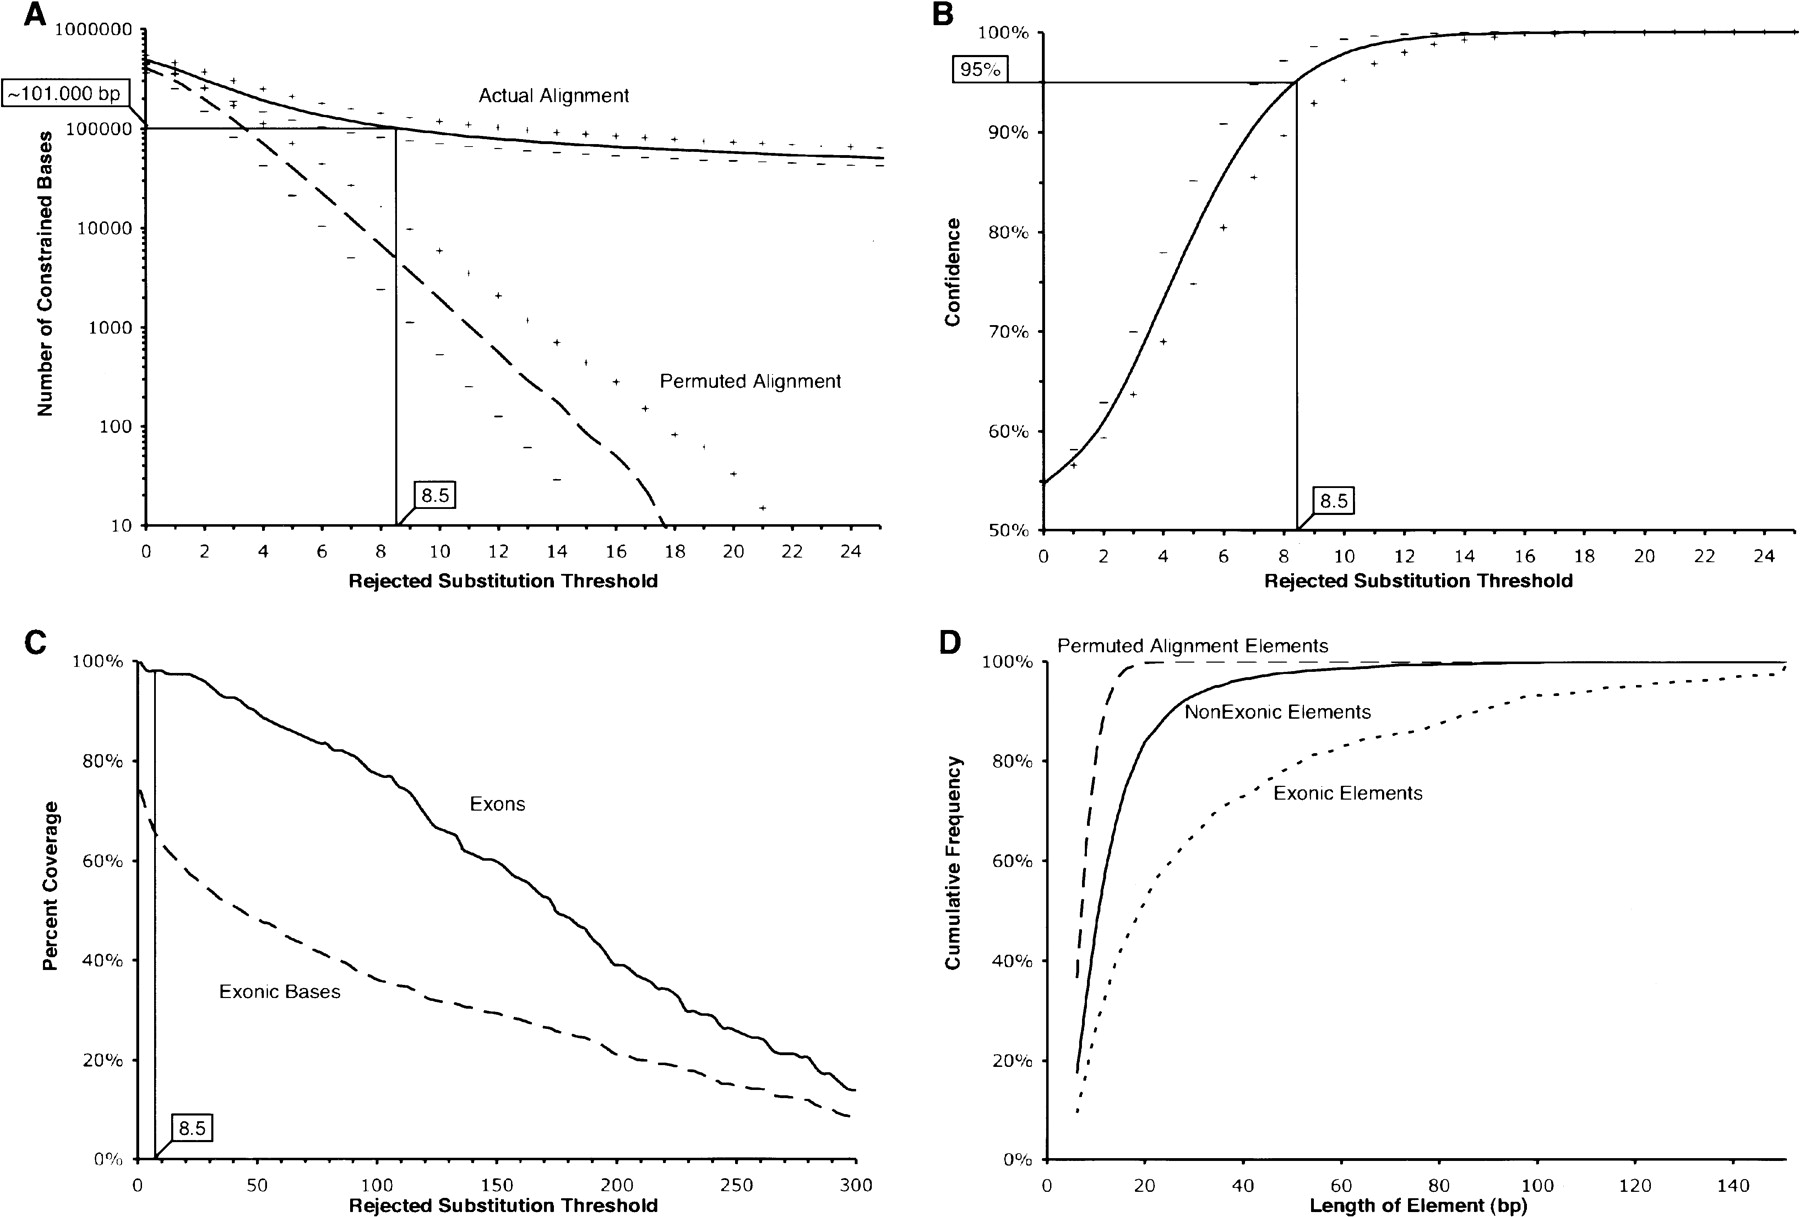
Confidence and sensitivity of GERP as a function of the rejected substitution threshold used to identify constrained elements. (A) Number of constrained element bases identified in the real alignment (solid line) and permuted alignments (dashed line). (B) Confidence is defined as the number of constrained element bases in the actual alignment divided by the sum of the constrained element bases in the actual and permuted alignments (see Methods). In A and B, the curves indicated with “+” and “–” characters result from analyses using a neutral rate estimate that is 10% greater or less, respectively, than the estimate of 3.85 neutral subs/site. A vertical black line marks the RS score threshold of 8.5 (corresponding to a confidence of ∼95%). (C) The fraction of exons that overlap at least one constrained element (solid line), and the fraction of exonic bases within a constrained element (dashed line). (D) Cumulative frequencies of the sizes of constrained elements at an RS of 8.5 or greater, with permuted alignment elements (heavy dashed line), exclusively nonexonic constrained elements (solid line), and exonic elements (light dashed line).


