
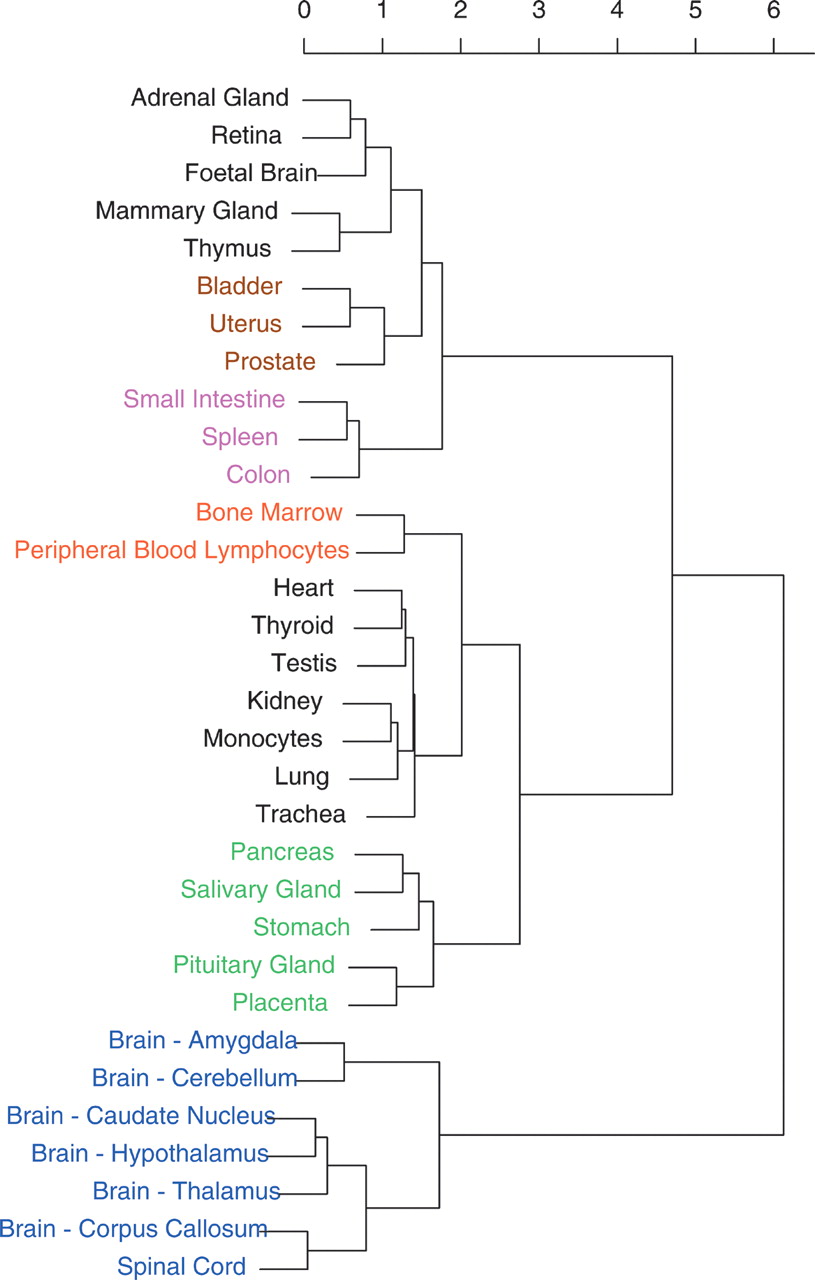
Figure 4.
Hierarchical clustering of tissues based on their pairwise distances (d = 1 - r), using the Ward statistical method. Groups of clustered tissues are colored according to common properties: (magenta) lymphoid tissues; (red) hematopoietic tissues; (green) intestinal tract; (blue) central nervous system.


