
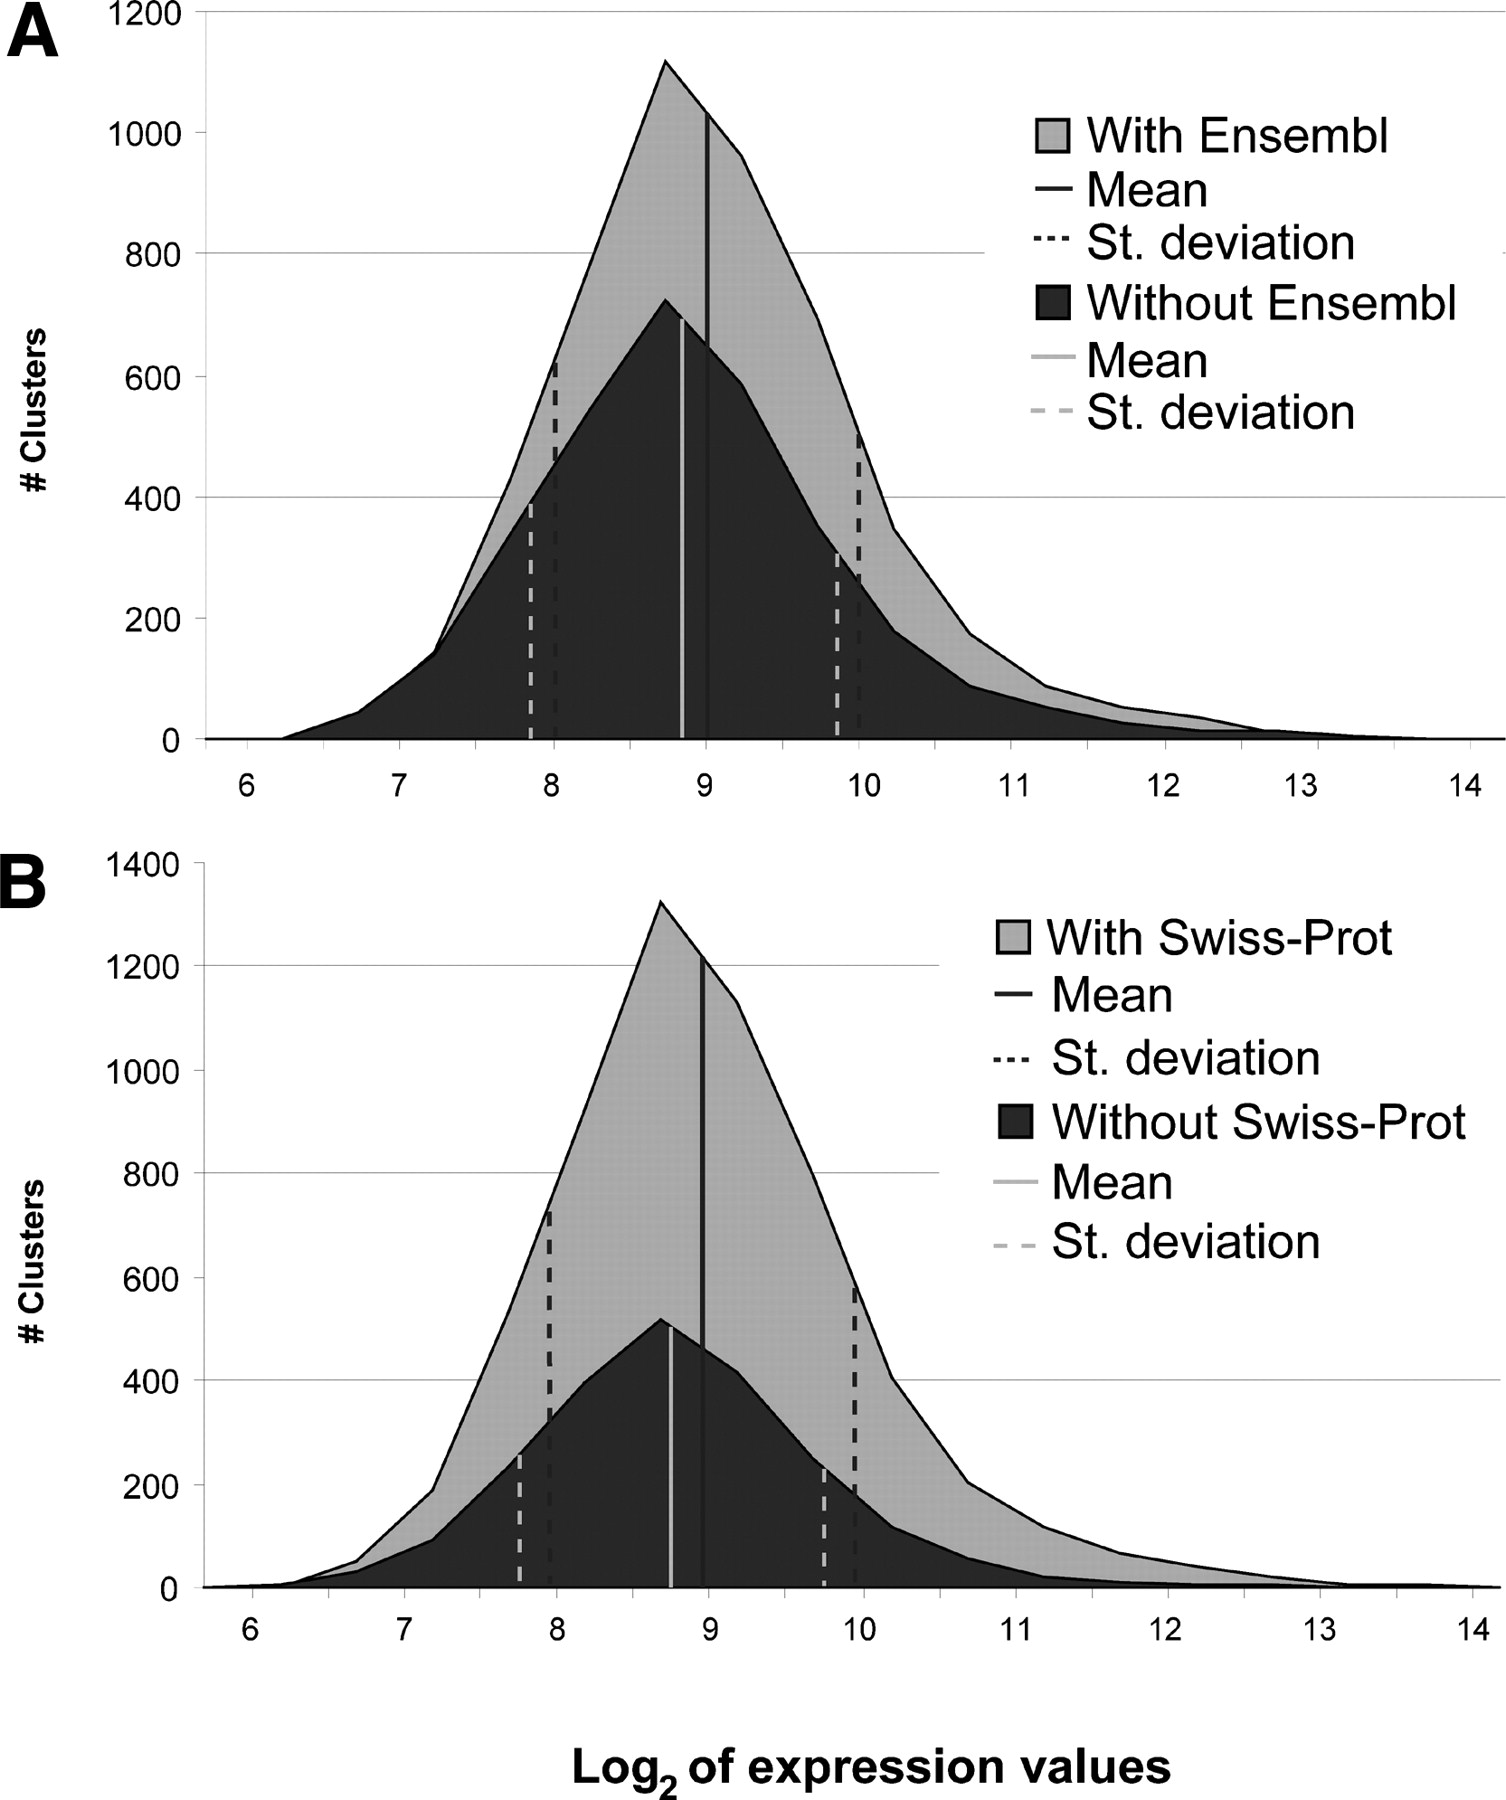
Figure 2.
(A) Comparison of log2 expression value distributions for T-clusters with and without overlaps with Ensembl gene predictions. The graph also depicts mean and standard deviation values for the corresponding distributions. (B) Comparison of log2 expression value distributions for T-clusters with and without homology hits in the SWISS-PROT knowledgebase; mean and standard deviation values are also shown.


