
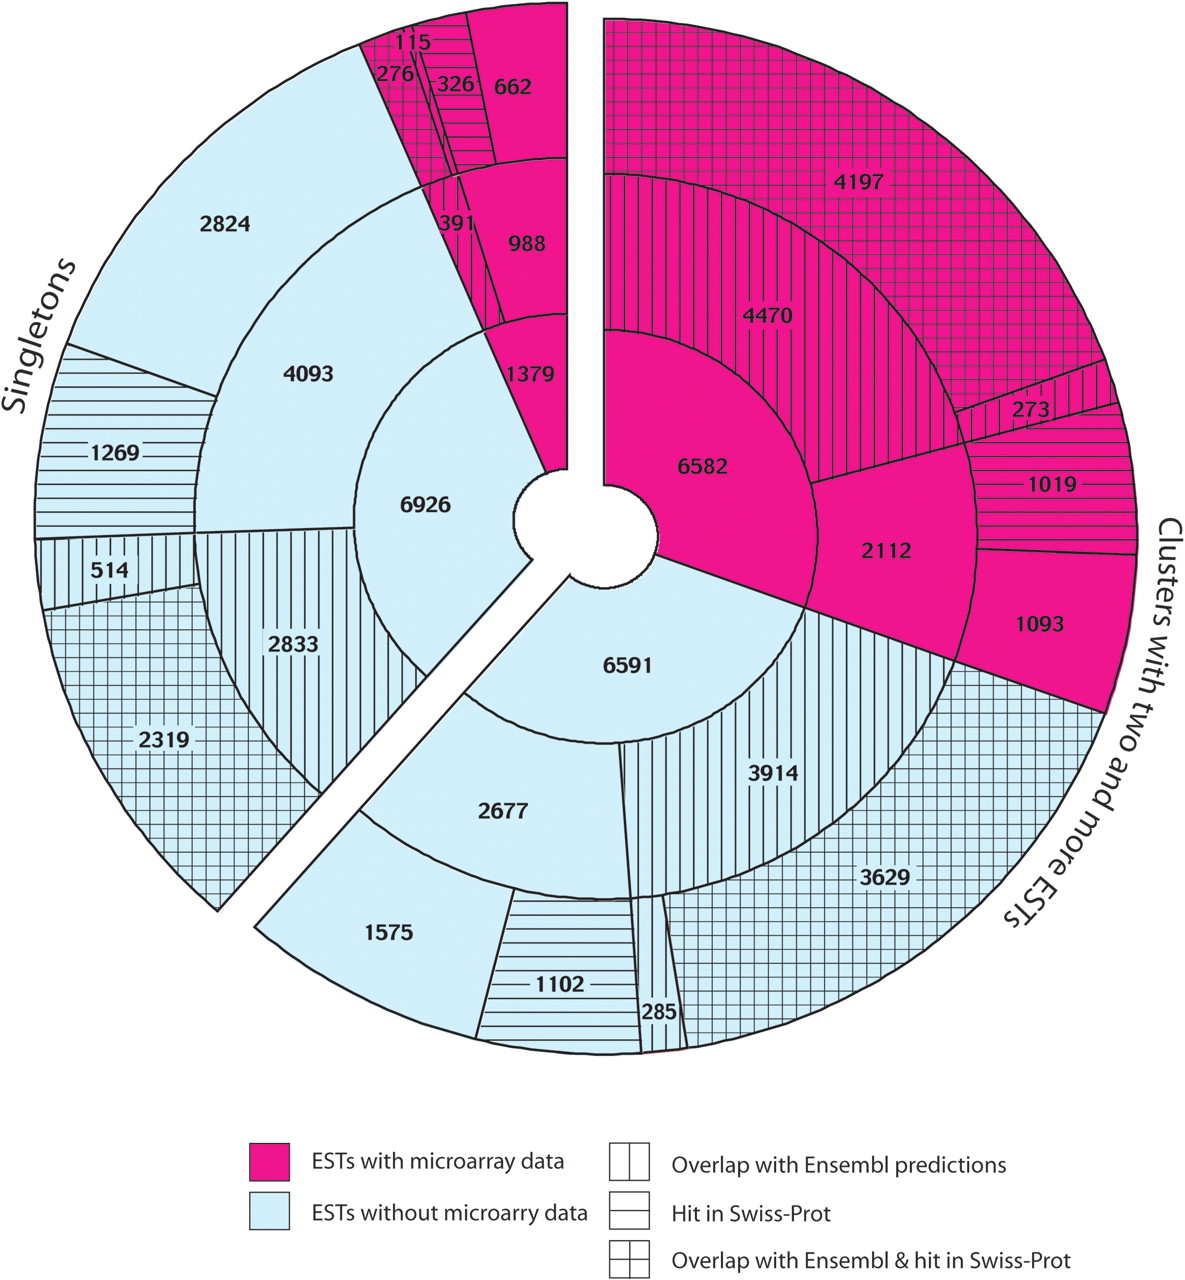
Analysis of the 21,478 T-clusters. The chart lists numbers of T-clusters, of which expression during mosquito development was confirmed by microarray experiments (pink) and numbers of clusters for which microarray-based expression was not tested or detected (blue). Numbers are provided separately for clusters with two or more ESTs (right) and singletons (clusters with one EST, left). For each category, the numbers of clusters with and without Ensembl gene predictions, as well as the numbers with and without homologs in UniProt/SWISS-PROT are indicated. The inner ring lists the total number of EST clusters with and without microarray data, and the outer two rings partition these clusters according to the associated annotation.


