
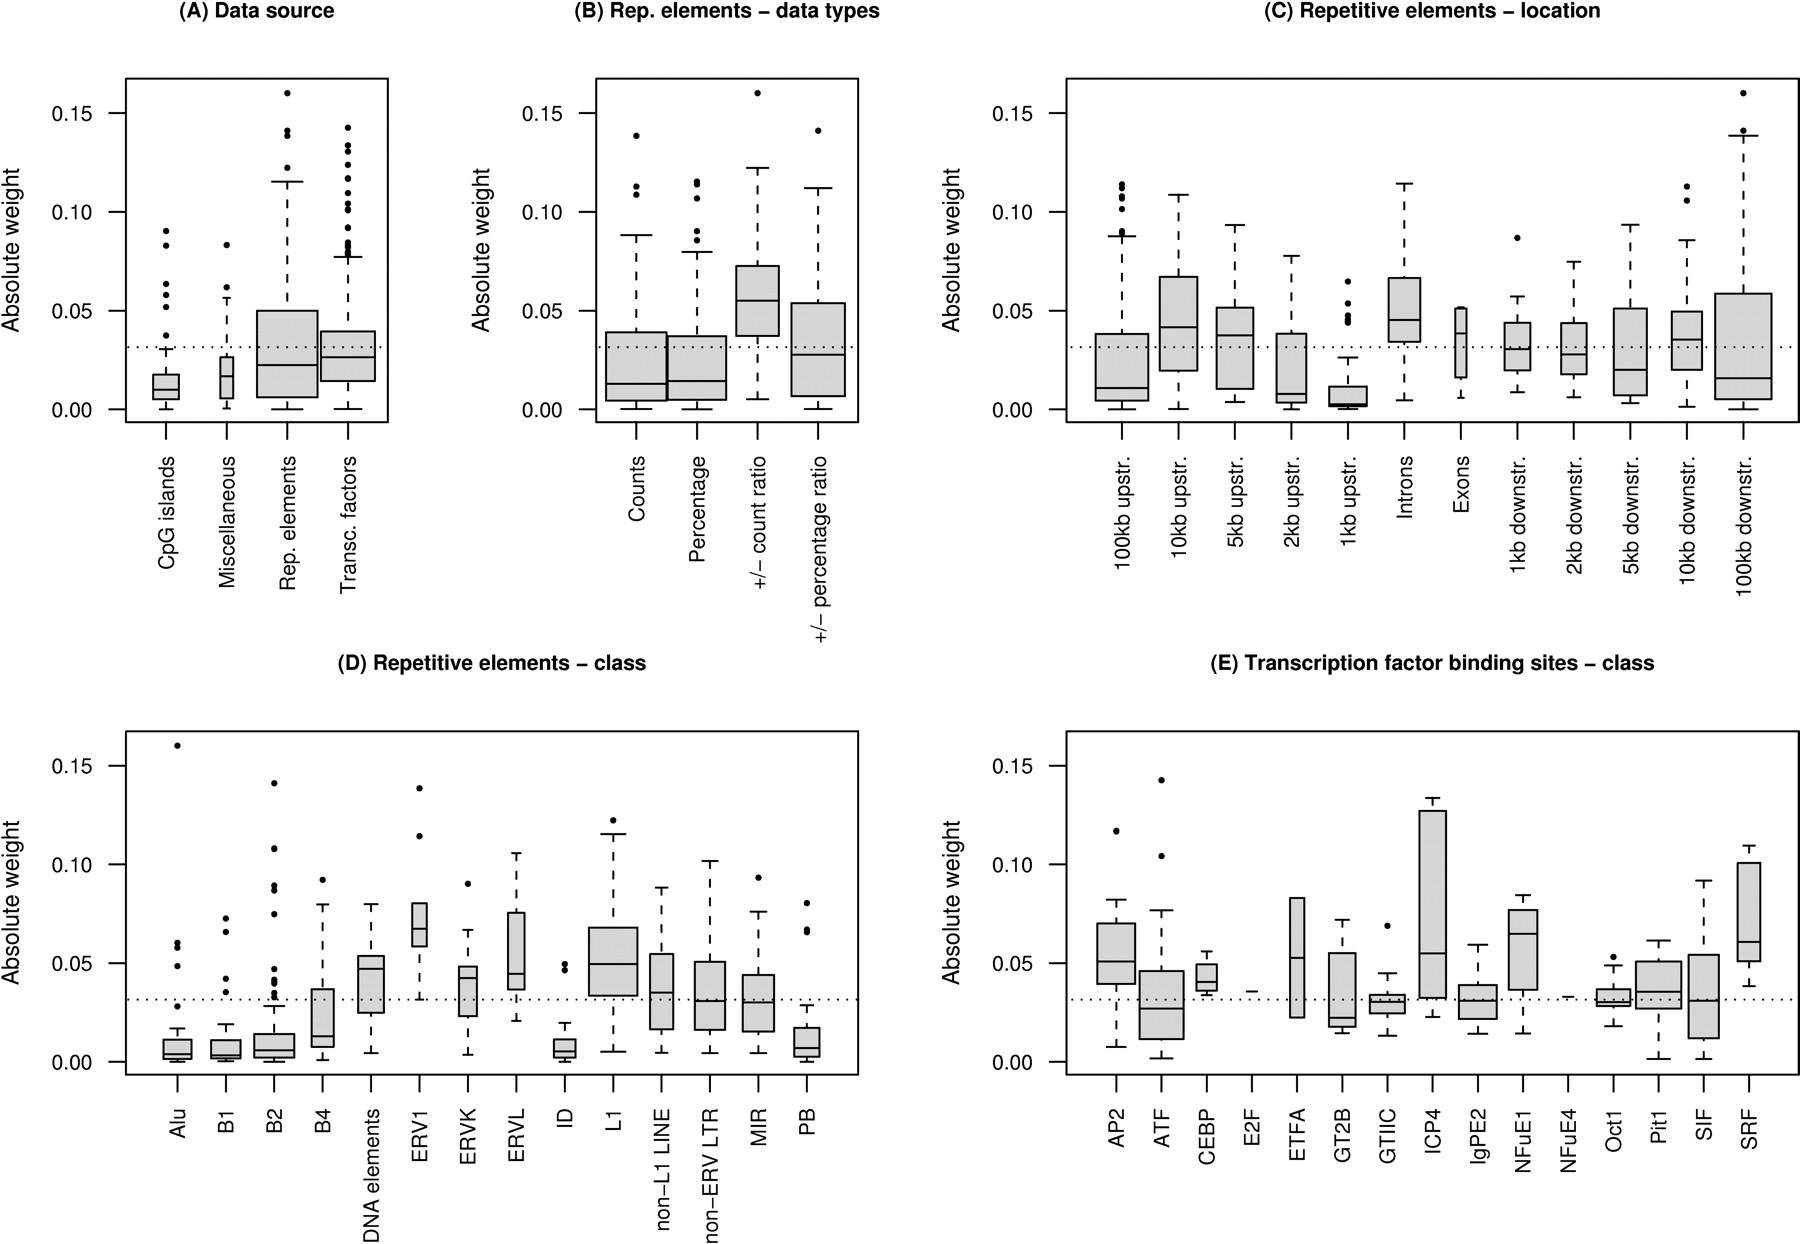
Box plots of the absolute weights of the features used in the imprinted vs. nonimprinted classifier. (A) The largest number of features was based on repetitive elements, followed by transcription factor binding sites, CpG islands, and other miscellaneous features. (B) On average, the ratios of ± counts of repetitive elements carried the greatest absolute weight (P = 3 × 10-12). (C) Data on repetitive elements within the introns were the most important (P = 4 × 10⁻⁴), followed by the 10-kb upstream region (P = 6 × 10⁻³), while the 1-kb upstream window was of least importance (P = 5 × 10⁻¹⁰). (D) Among the repetitive elements, ERV1 (P = 2 × 10⁻⁵) and ERVL (P = 5 × 10⁻³) were of greatest average importance, followed by LINE L1 elements (P = 4 × 10-15). (E) SRF (P = 1 × 10⁻⁴), NFuE1 (P = 2 × 10⁻³), and AP2 (P = 1 × 10⁻²) were the most important transcription factor binding sites. The dotted line represents the overall mean.


