
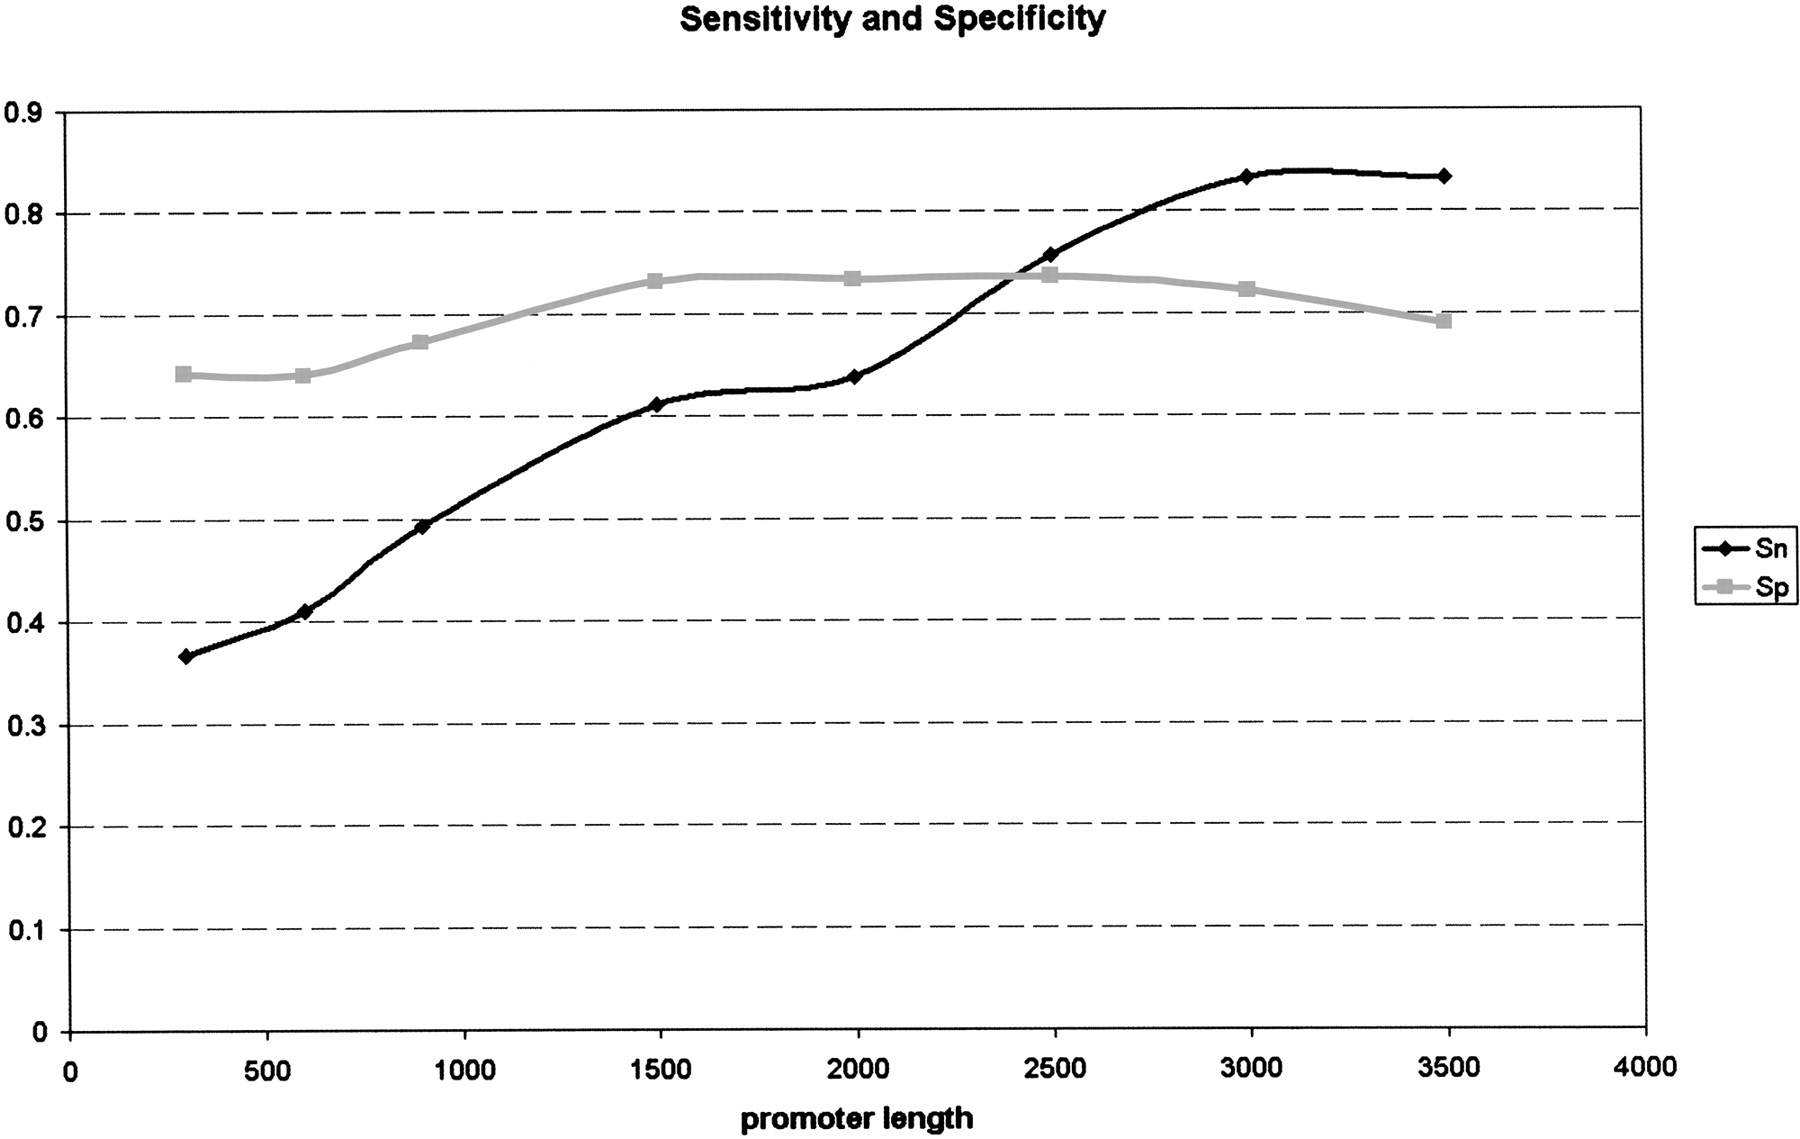
Figure 3.
Sensitivity and specificity performance of Footer in relation to the analyzed promoter length. This graph presents the sensitivity (black line) and specificity (gray line) over all promoter regions analyzed (see text). According to this graph, Footer performance increases with examined promoter length up to 3 kb, while specificity remains essentially constant.


