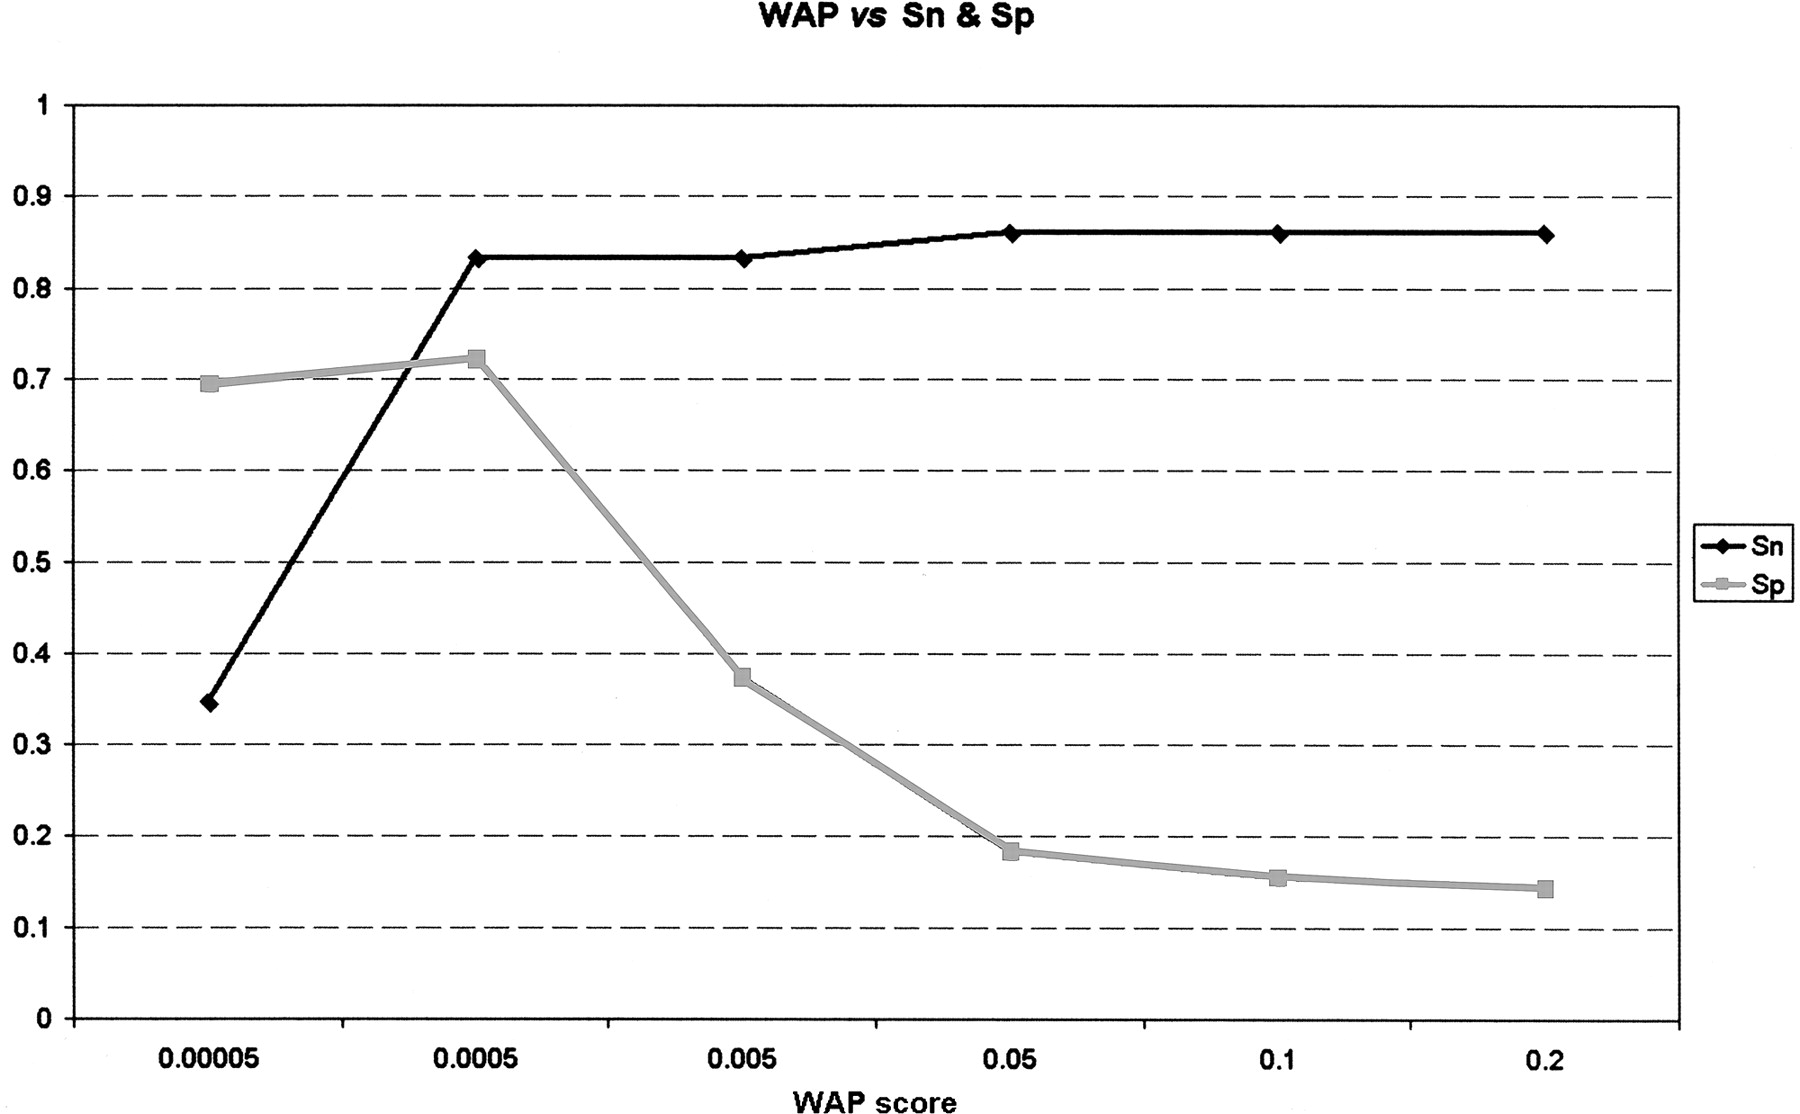
Footer: A quantitative comparative genomics method for efficient recognition of cis-regulatory elements

(Downloading may take up to 30 seconds. If the slide opens in your browser, select File -> Save As to save it.)

Click on image to view larger version.

Figure 2.
Figure 2.

Performance of Footer in relation to the WAP threshold. This graph presents the sensitivity (black line) and specificity (gray line) over all promoter regions analyzed (see text). According to this graph, Footer performs best on a WAP threshold of 0.05%.

This Article

  1. Genome Res. 15: 840-847

Preprint Server