
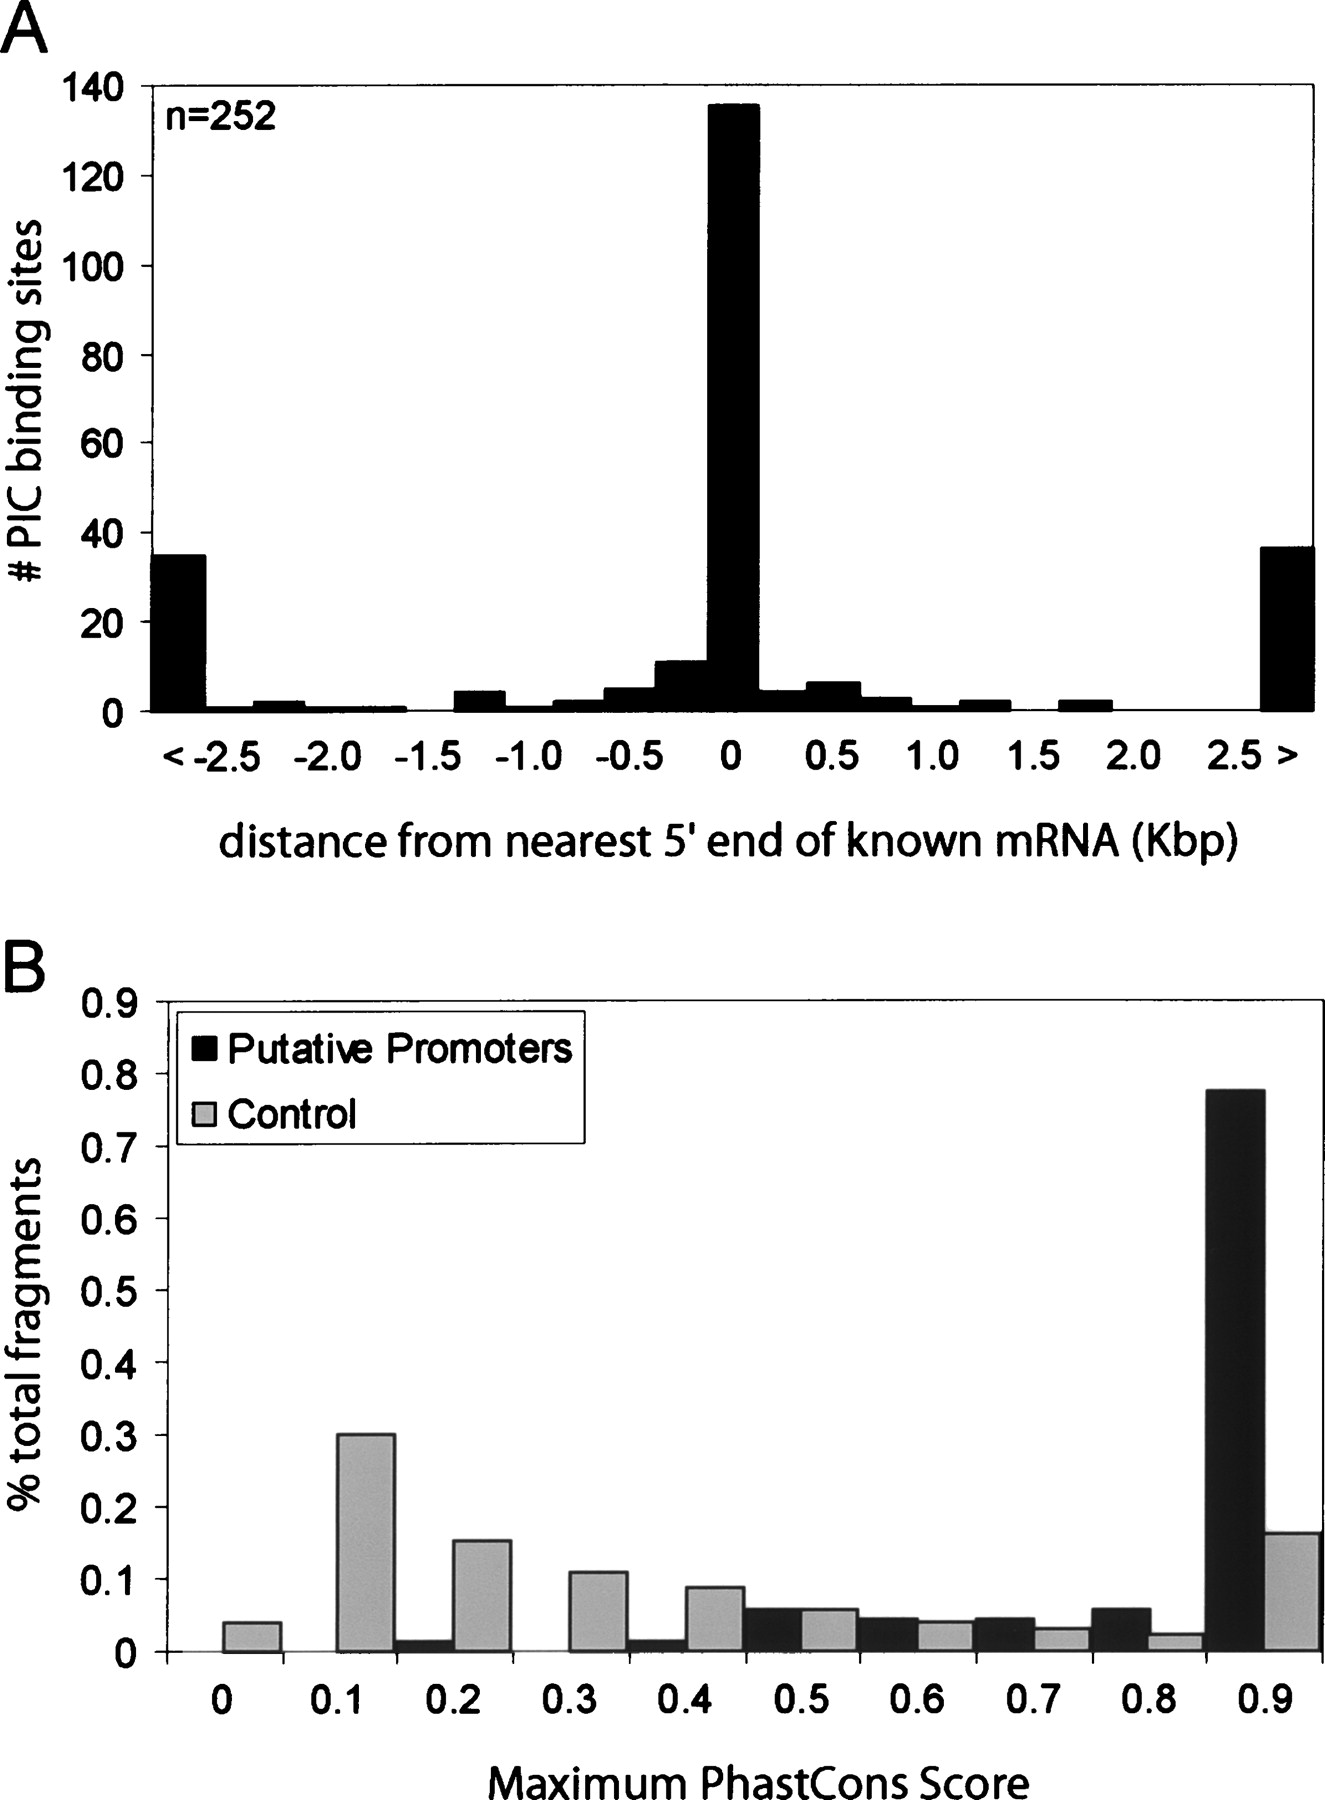
Summary of promoters identified in IMR90, HCT116, HeLa, and THP1 cells. (A) Distribution (number of PIC-binding sites in all four cell lines, y-axis) of relative distance (in Kbp, x-axis) of the PIC-binding sites to the nearest 5′ ends of full-length GenBank mRNA. The first and last bars are counts for those PIC-binding sites that are >2.5 Kbp upstream (<) or downstream (>) from the nearest 5′ end. (B) Conservation analysis of 71 putative promoters identified in four cell lines (in dark gray bars) and control genomic fragments (in light gray bars). The x-axis represents conservation score, PhastCons, and the y-axis represents the percentage of all putative promoters (or the control genomic fragments) with the corresponding PhastCons score.


