
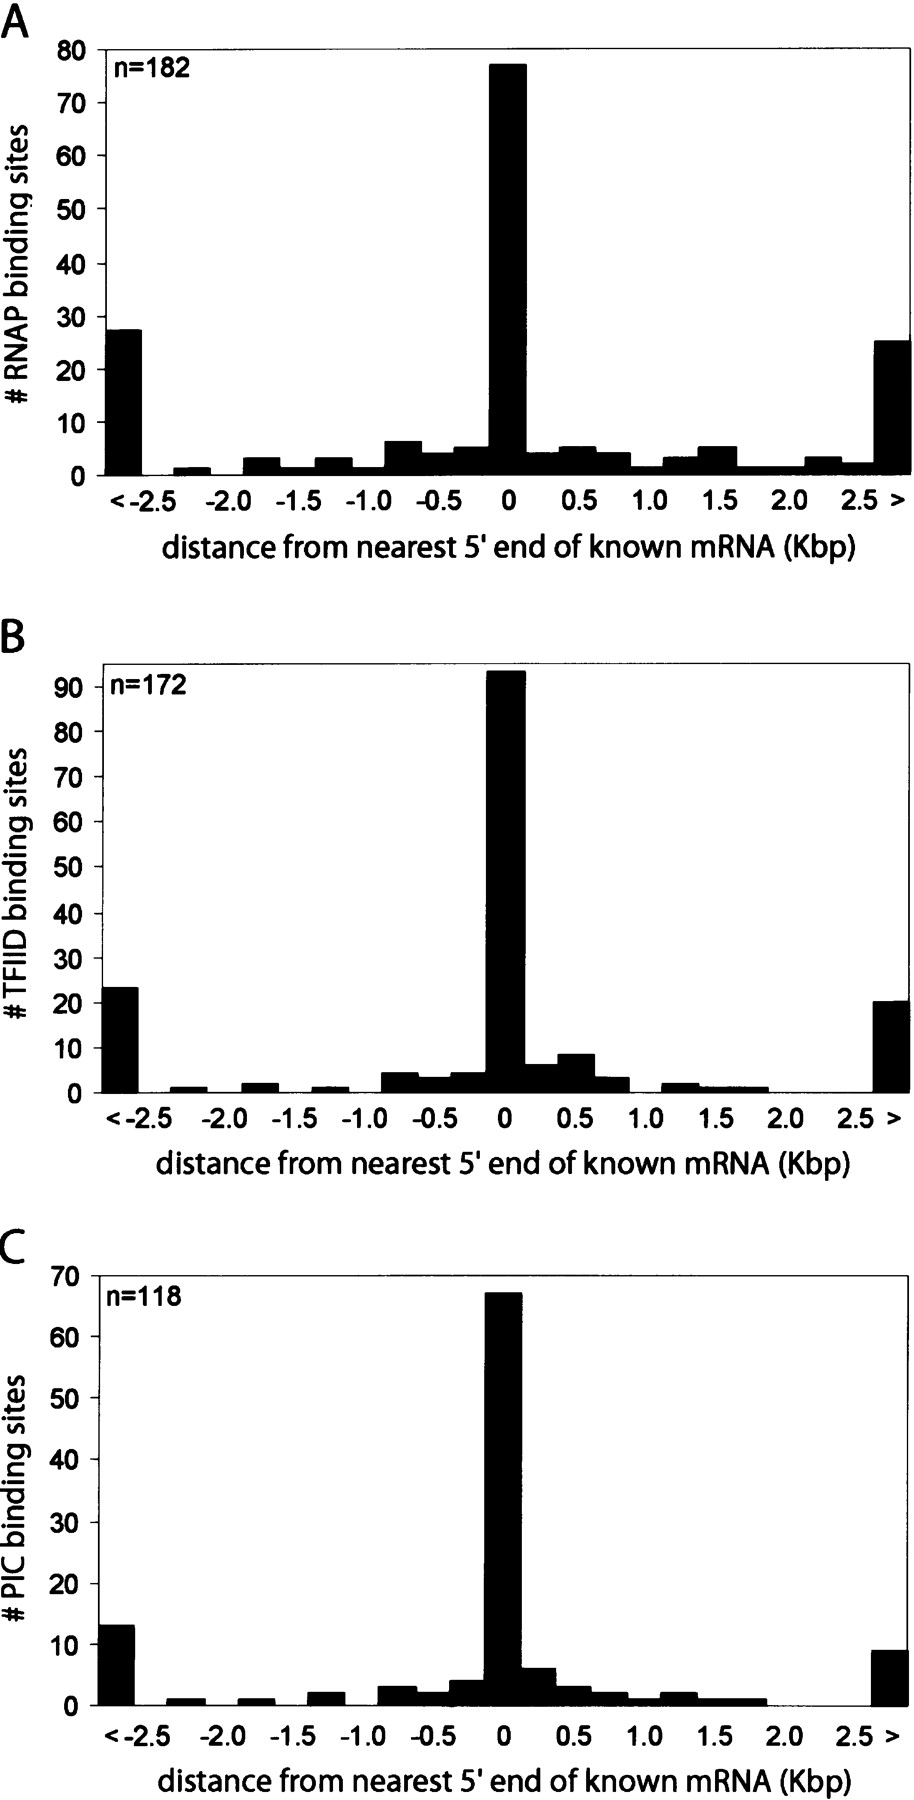
Summary of identified PIC-binding sites matched to transcripts in IMR90. Histograms plotting relative distance of the RNAP-, TFIID-, or PIC-binding sites to the nearest 5′ ends of full-length GenBank RefSeq transcripts. (A) Distribution (number of RNAP-binding sites, y-axis) of relative distances (in Kbp, x-axis) of the RNAP-binding sites to the nearest 5′ ends of full length mRNA. The first and last bars are counts for those RNAP-binding sites that are >2.5 Kbp upstream (<) or downstream (>) from the nearest 5′ end. (B) Distribution (number of TFIID-binding sites, y-axis) of relative distances (in Kbp, x-axis) of the TFIID-binding sites to the nearest 5′ ends of full-length mRNA. The first and last bars are counts for those TFIID-binding sites that are >2.5 Kbp upstream (<) or downstream (>) from the nearest 5′ end. (C) Distribution (number of PIC-binding sites, y-axis) of relative distances (in Kbp, x-axis) of the PIC-binding sites to the nearest 5′ ends of full-length mRNA. The first and last bars are counts for those PIC-binding sites that are >2.5 Kbp upstream (<) or downstream (>) from the nearest 5′ end.


