
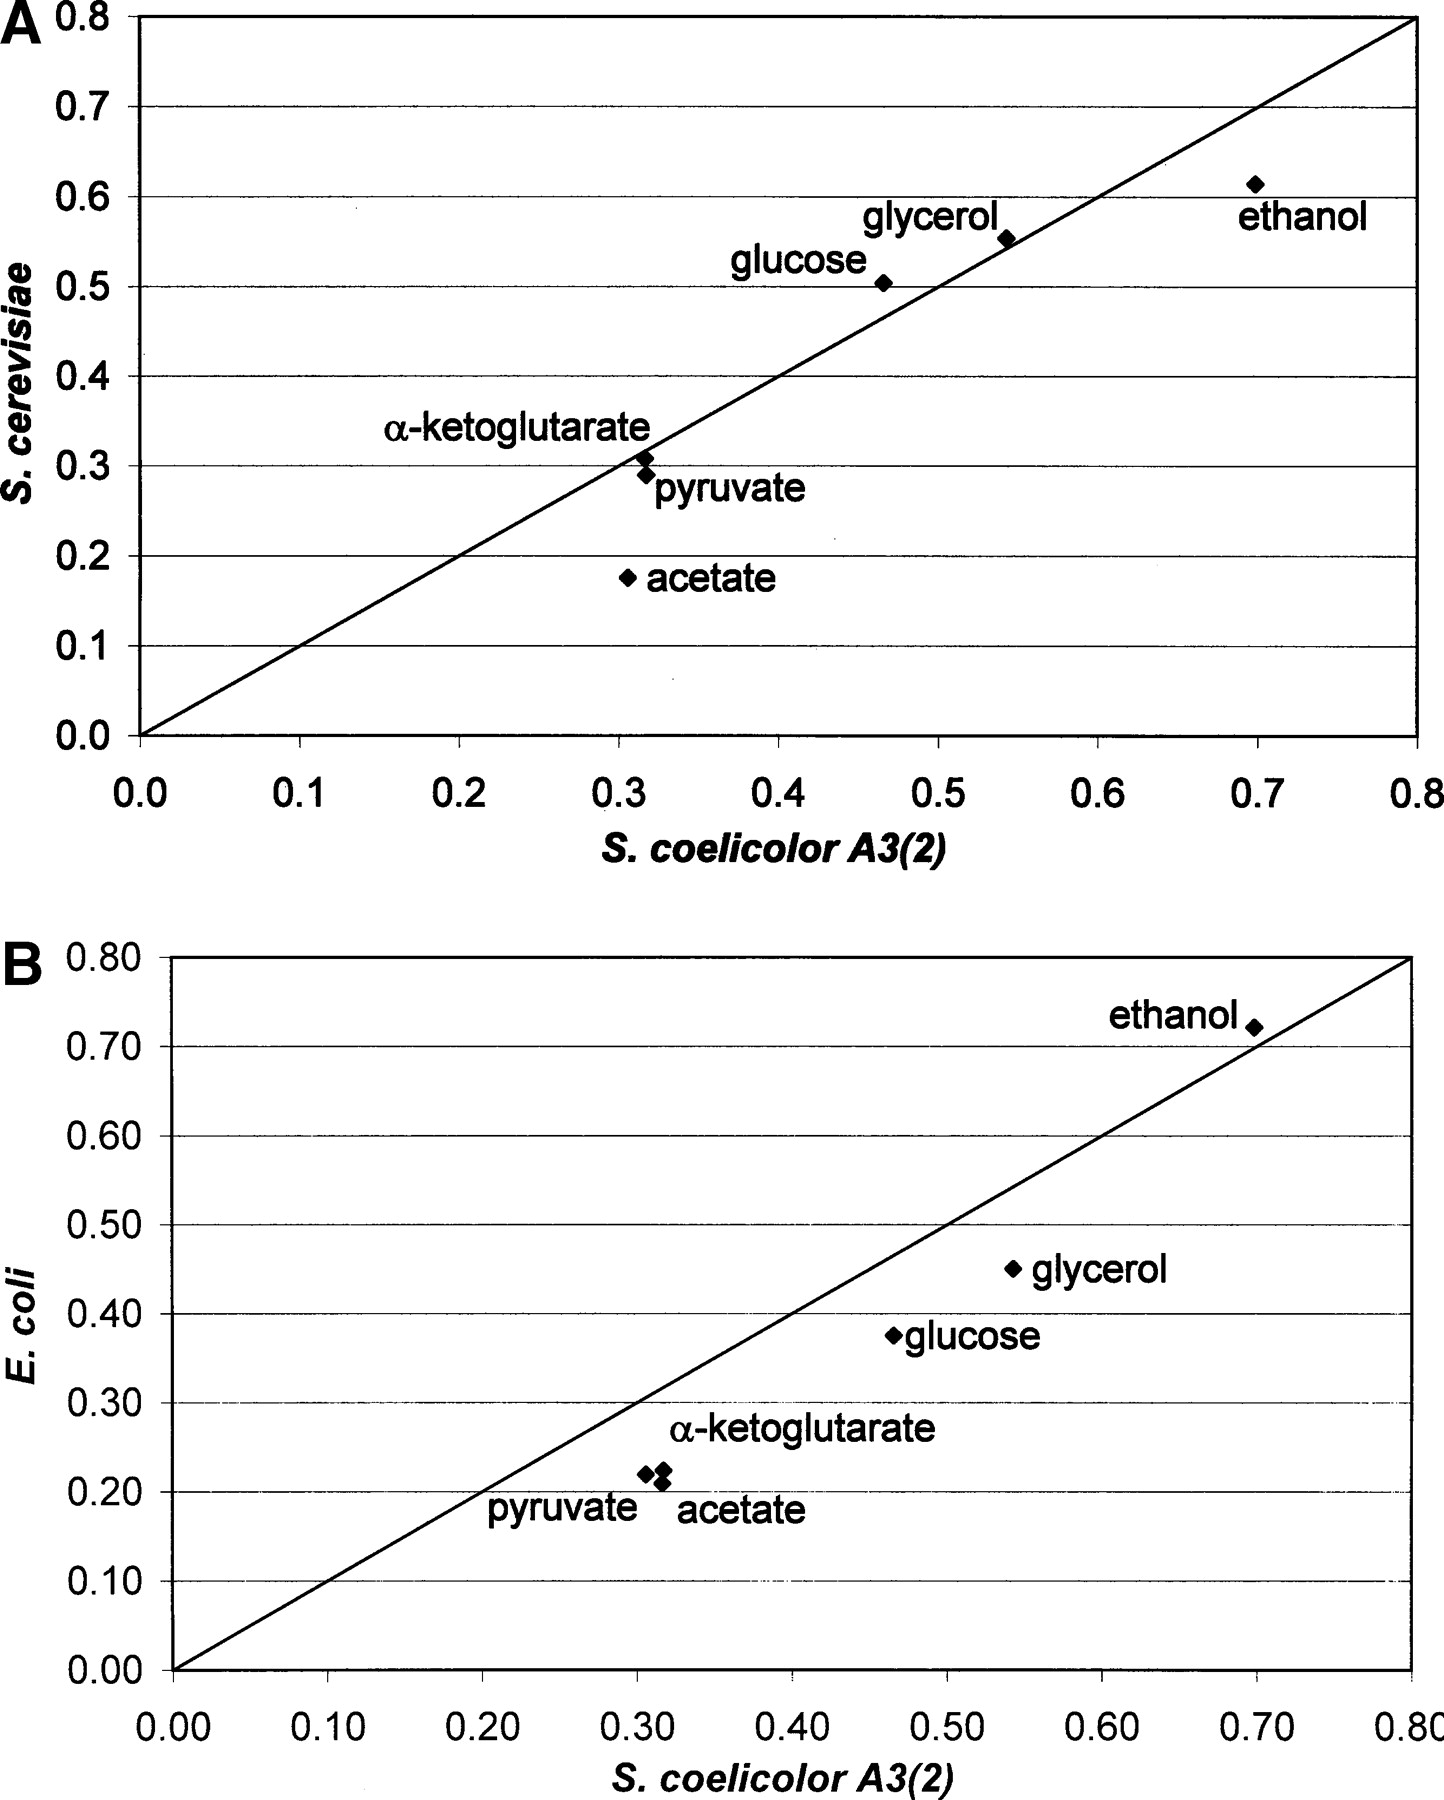
Figure 6.
Maximal simulated biomass yield of S. coelicolor A3(2) as compared to (A) S. cerevisiae (Förster et al. 2003a) and (B) E. coli (Edwards and Palsson 2000b) on different carbon sources (gram/gram substrate). All the calculations were made for substrate uptake rate of 6 C-mmol/g DW/h. The maintenance energy requirement was considered.


