
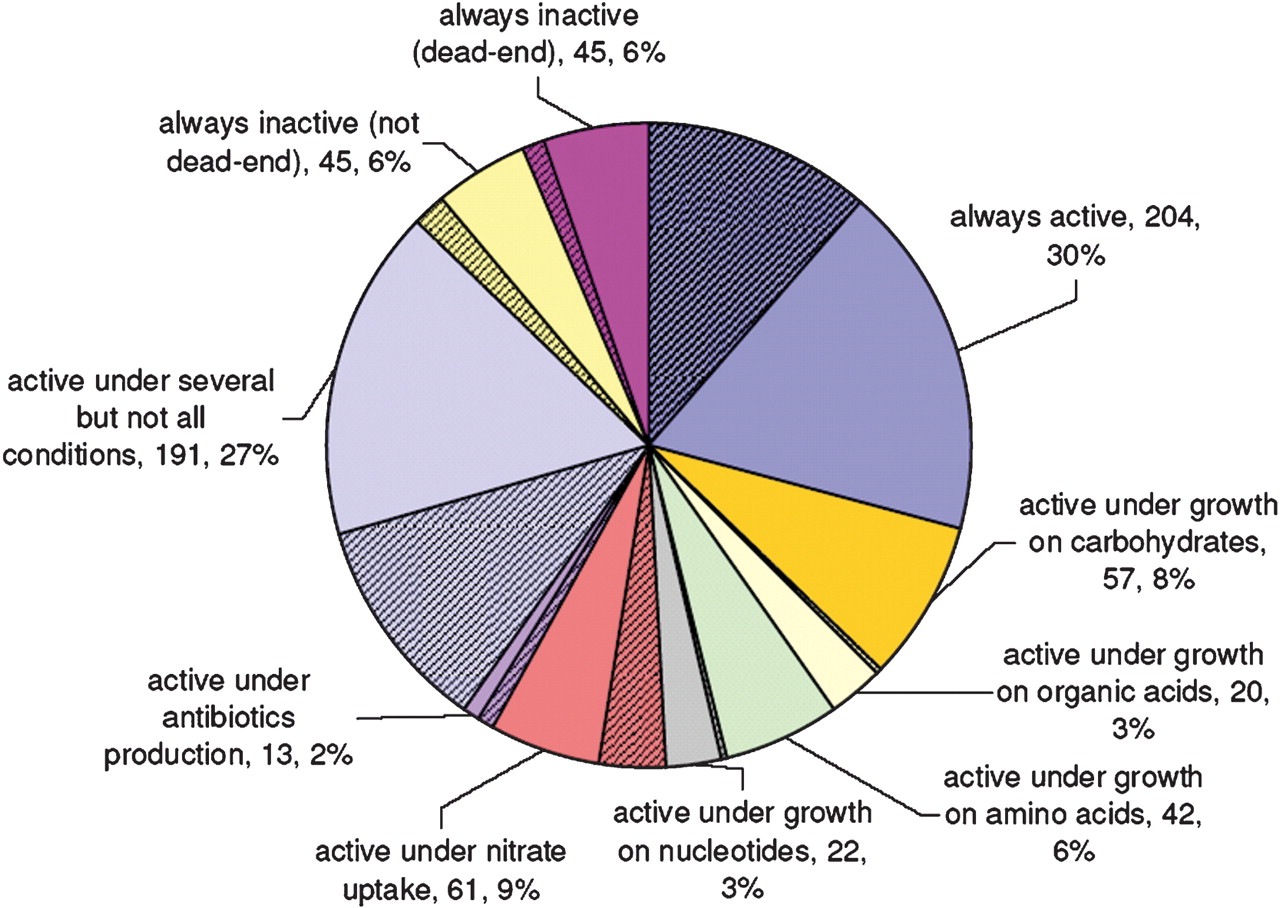
Figure 4.
Activity of the reactions in the model of S. coelicolor A3(2). All the unique reactions in the model are divided into several categories based on their predicted activity under different growth conditions. The proportion of reactions for which the corresponding enzymes were detected on a 2D gel is shown by the dashed areas.


