
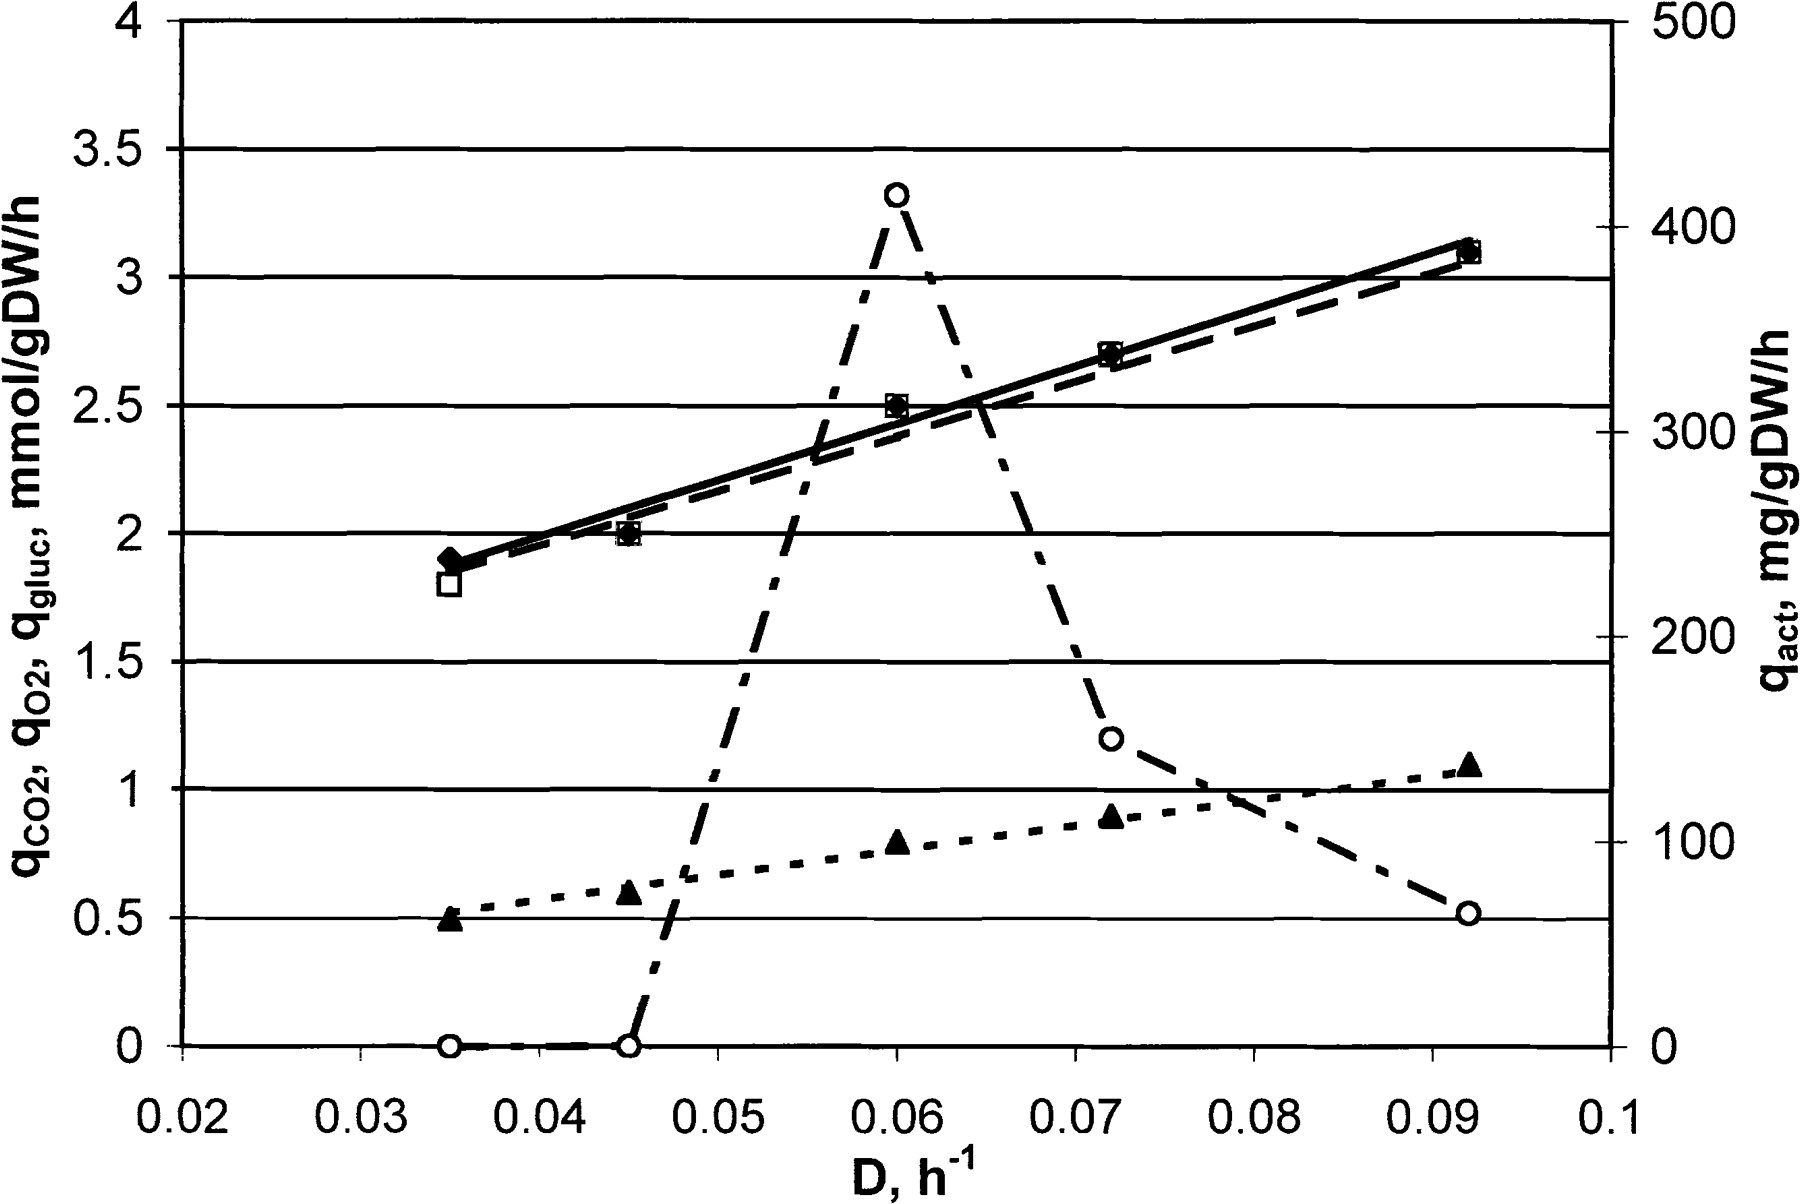
Figure 3.
Simulation of experimental chemostates data (Melzoch et al. 1997). Specific glucose uptake rate (experimental ▴, model ----), specific carbon dioxide production rate (experimental ♦, model ―), specific oxygen uptake rate (experimental □, model ---), and actinorhodin production rate (experimental ○, model — - — - — -).


