
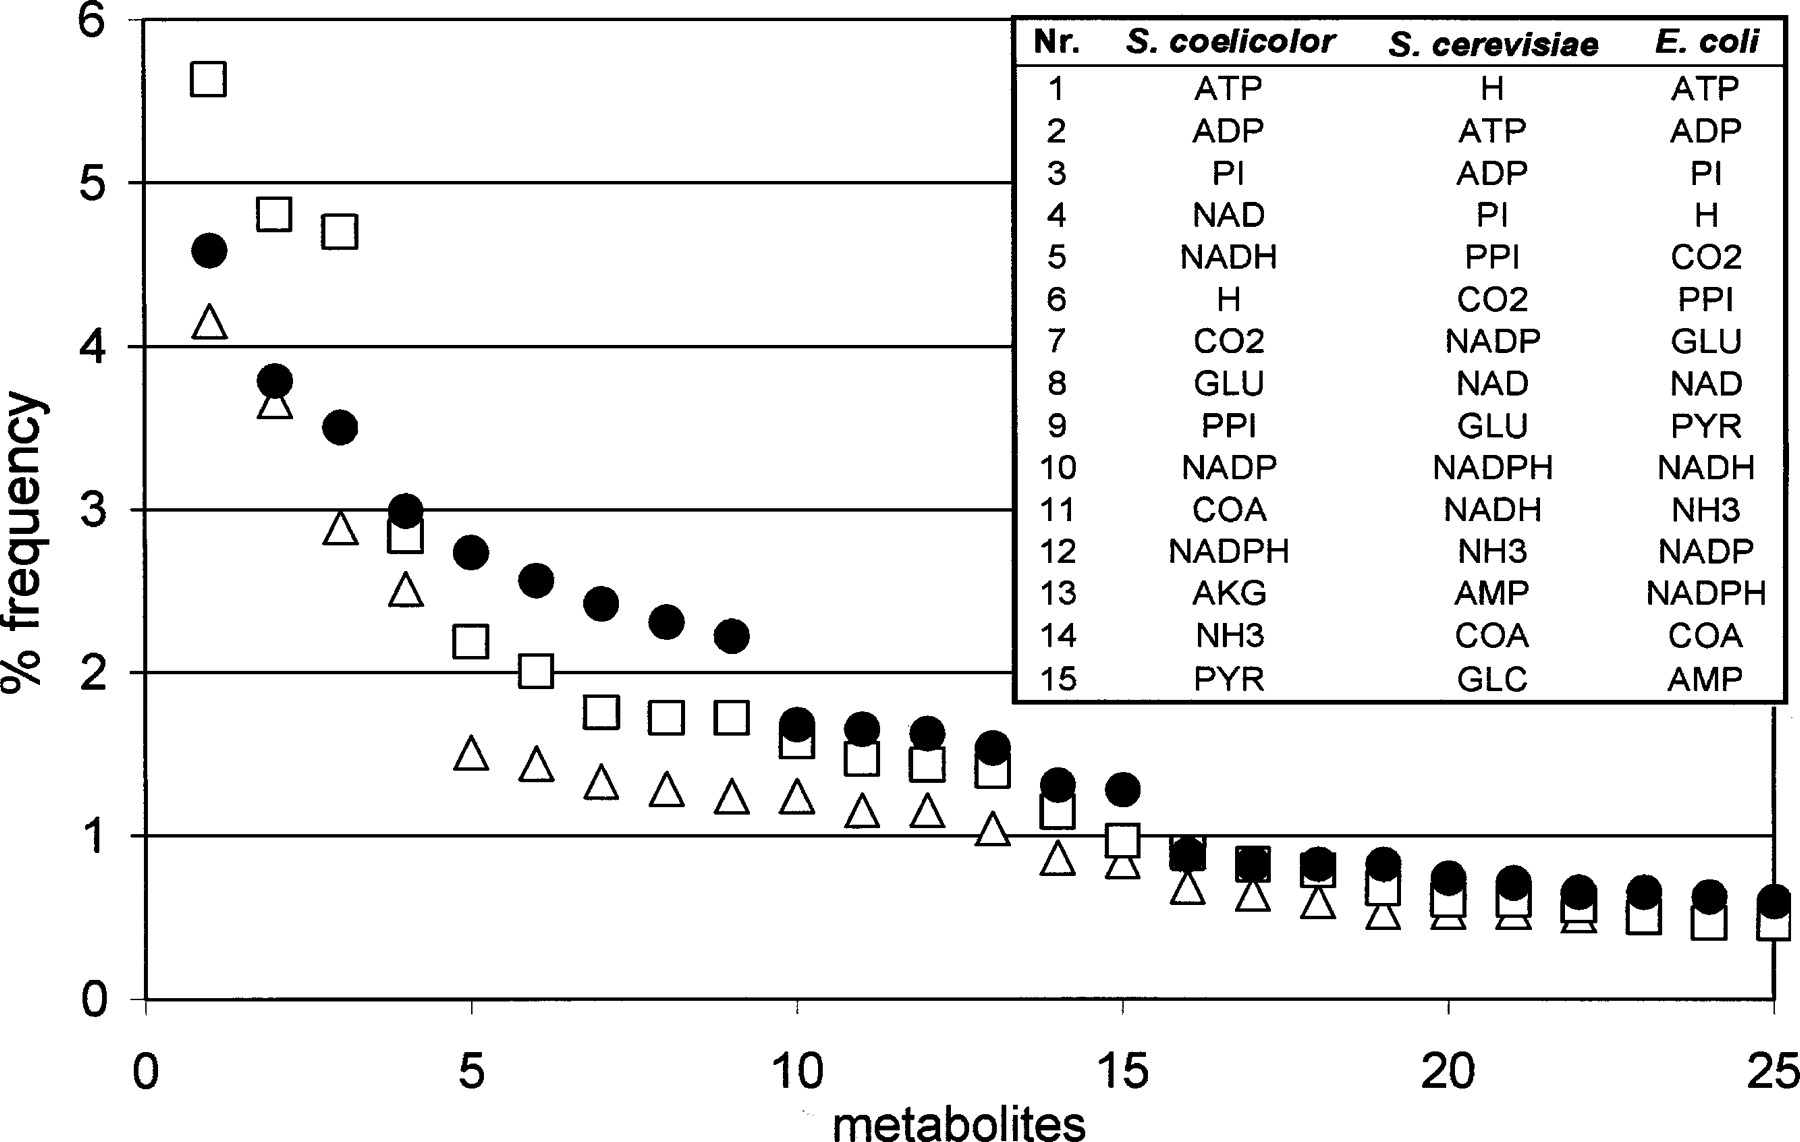
Figure 1.
Frequency of the most connected metabolites in the reconstructed metabolic networks of S. coelicolor A3(2), S. cerevisiae (Förster et al. 2003a), and E. coli (Edwards and Palsson 2000b). Frequency is calculated as the number of times a certain metabolite appears in the metabolic network divided by the sum of all metabolite occurrences. S. coelicolor A3(2) (•), S. cerevisiae (▵), E. coli (□). (H) External proton; (GLU) glutamate; (PPI) pyrophosphate; (COA) coenzyme A; (AKG) α-ketoglutarate; (PYR) pyruvate; (ACCOA) acetyl-coenzyme A; (ACP) acetyl-carrier protein.


