
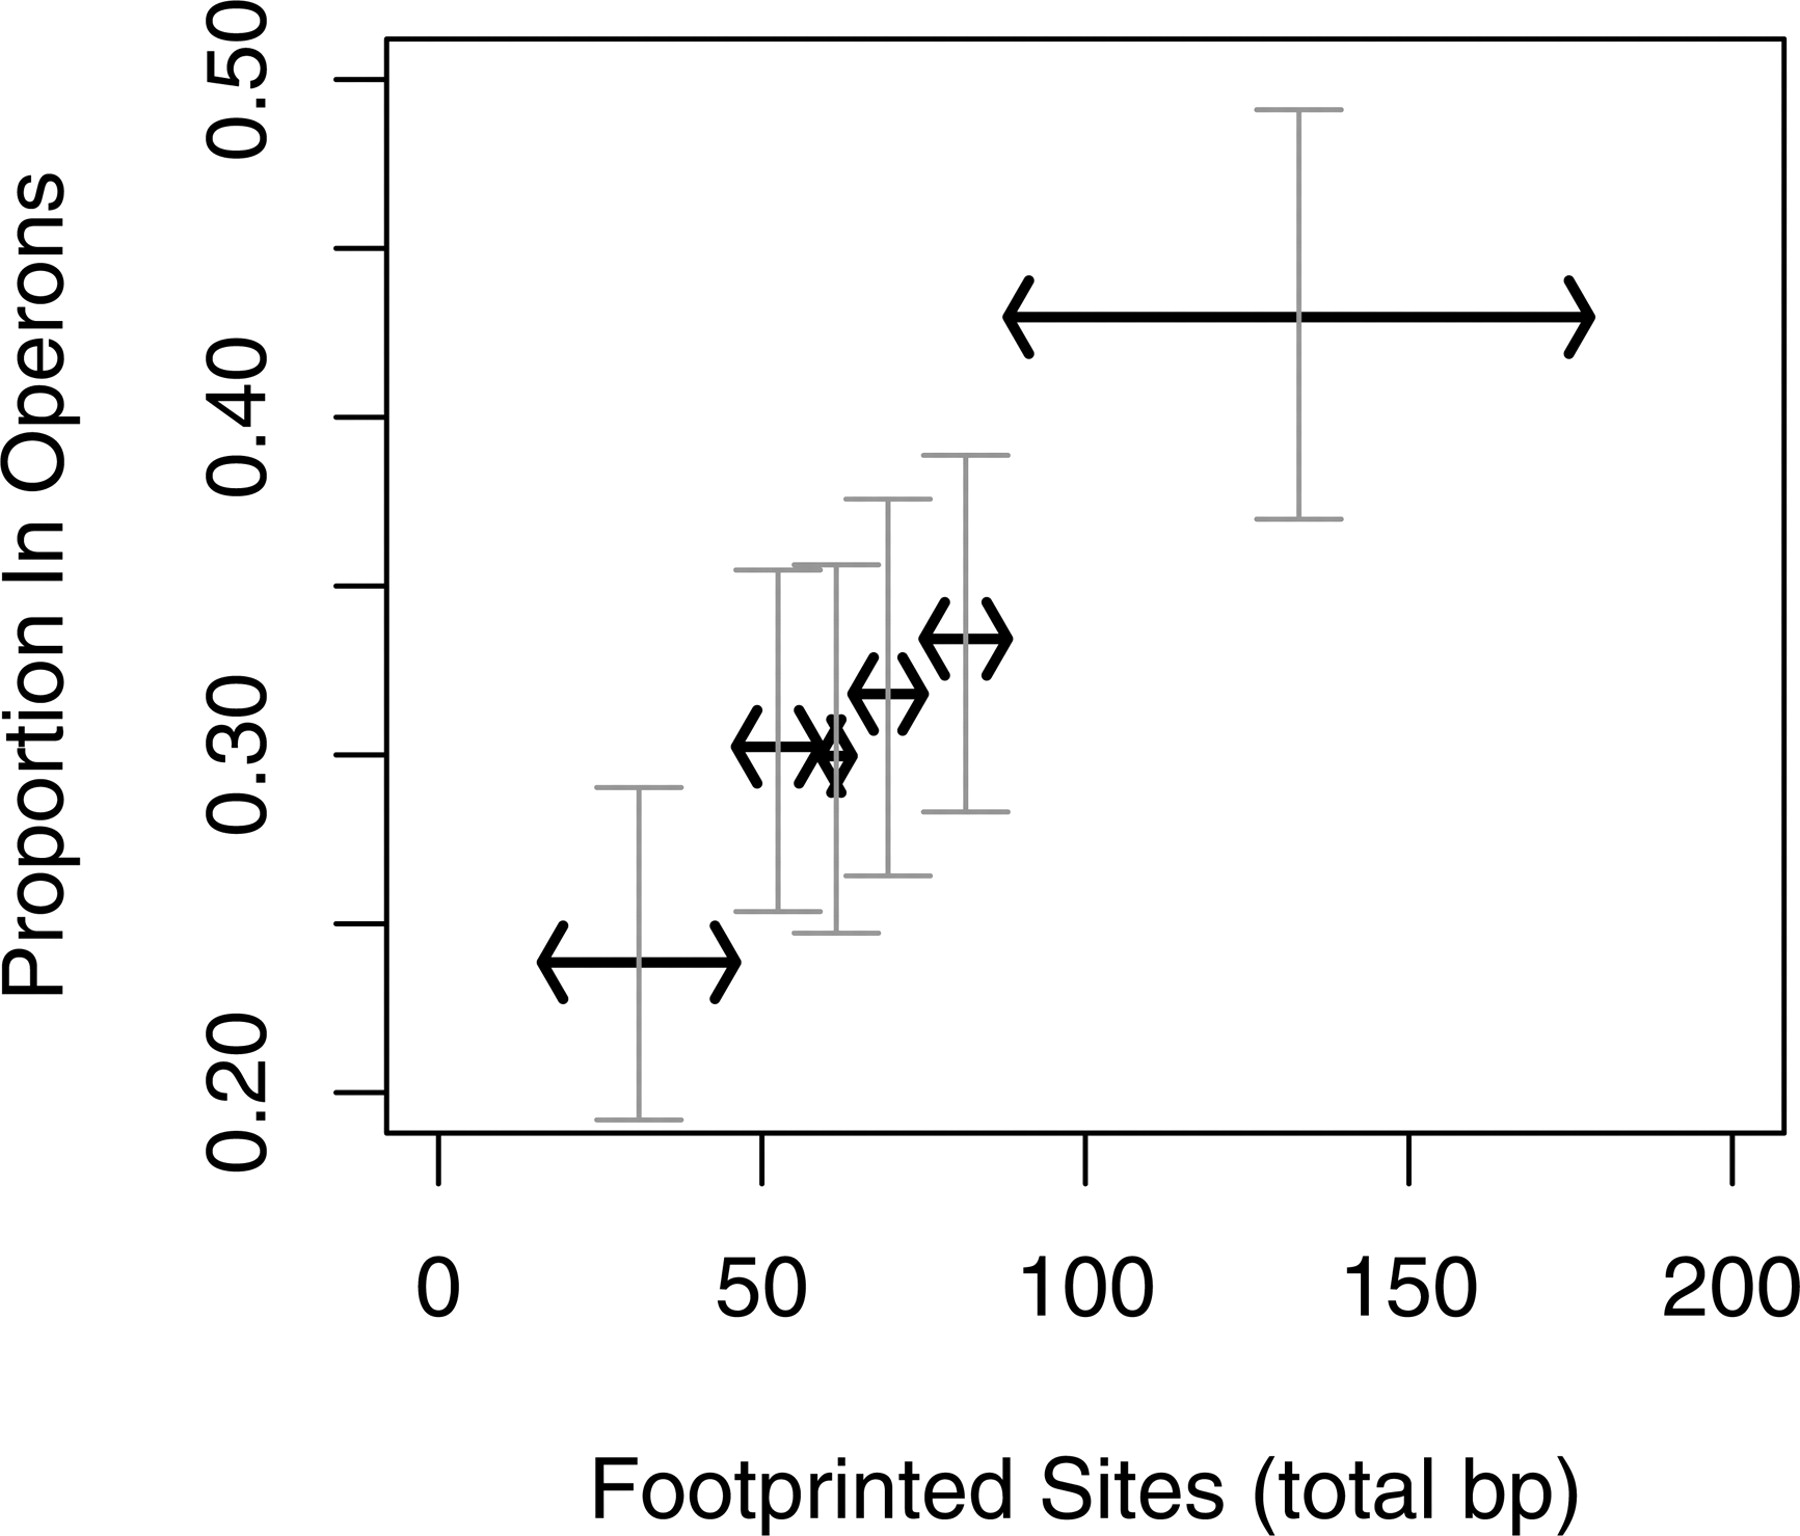
Genes with more conserved upstream sequences are more likely to be in operons. For each E. coli gene with one or more sites from phylogenetic footprinting (McCue et al. 2002), we asked whether it was predicted to be at the beginning of a multi-gene operon or to be transcribed by itself. For each group of genes with varying amounts of footprinted sequence, as measured in total base pairs and indicated with the horizontal arrows, the y-axis shows the proportion of genes that are in operons. (These ranges were chosen to give the same number of genes in each range.) For each range, a vertical bar shows the 90% confidence interval for the proportion (from the binomial test). Genes in the middle or at the end of predicted operons were excluded from this analysis, which is why the proportion of genes in operons is lower than in Figure 2.


