
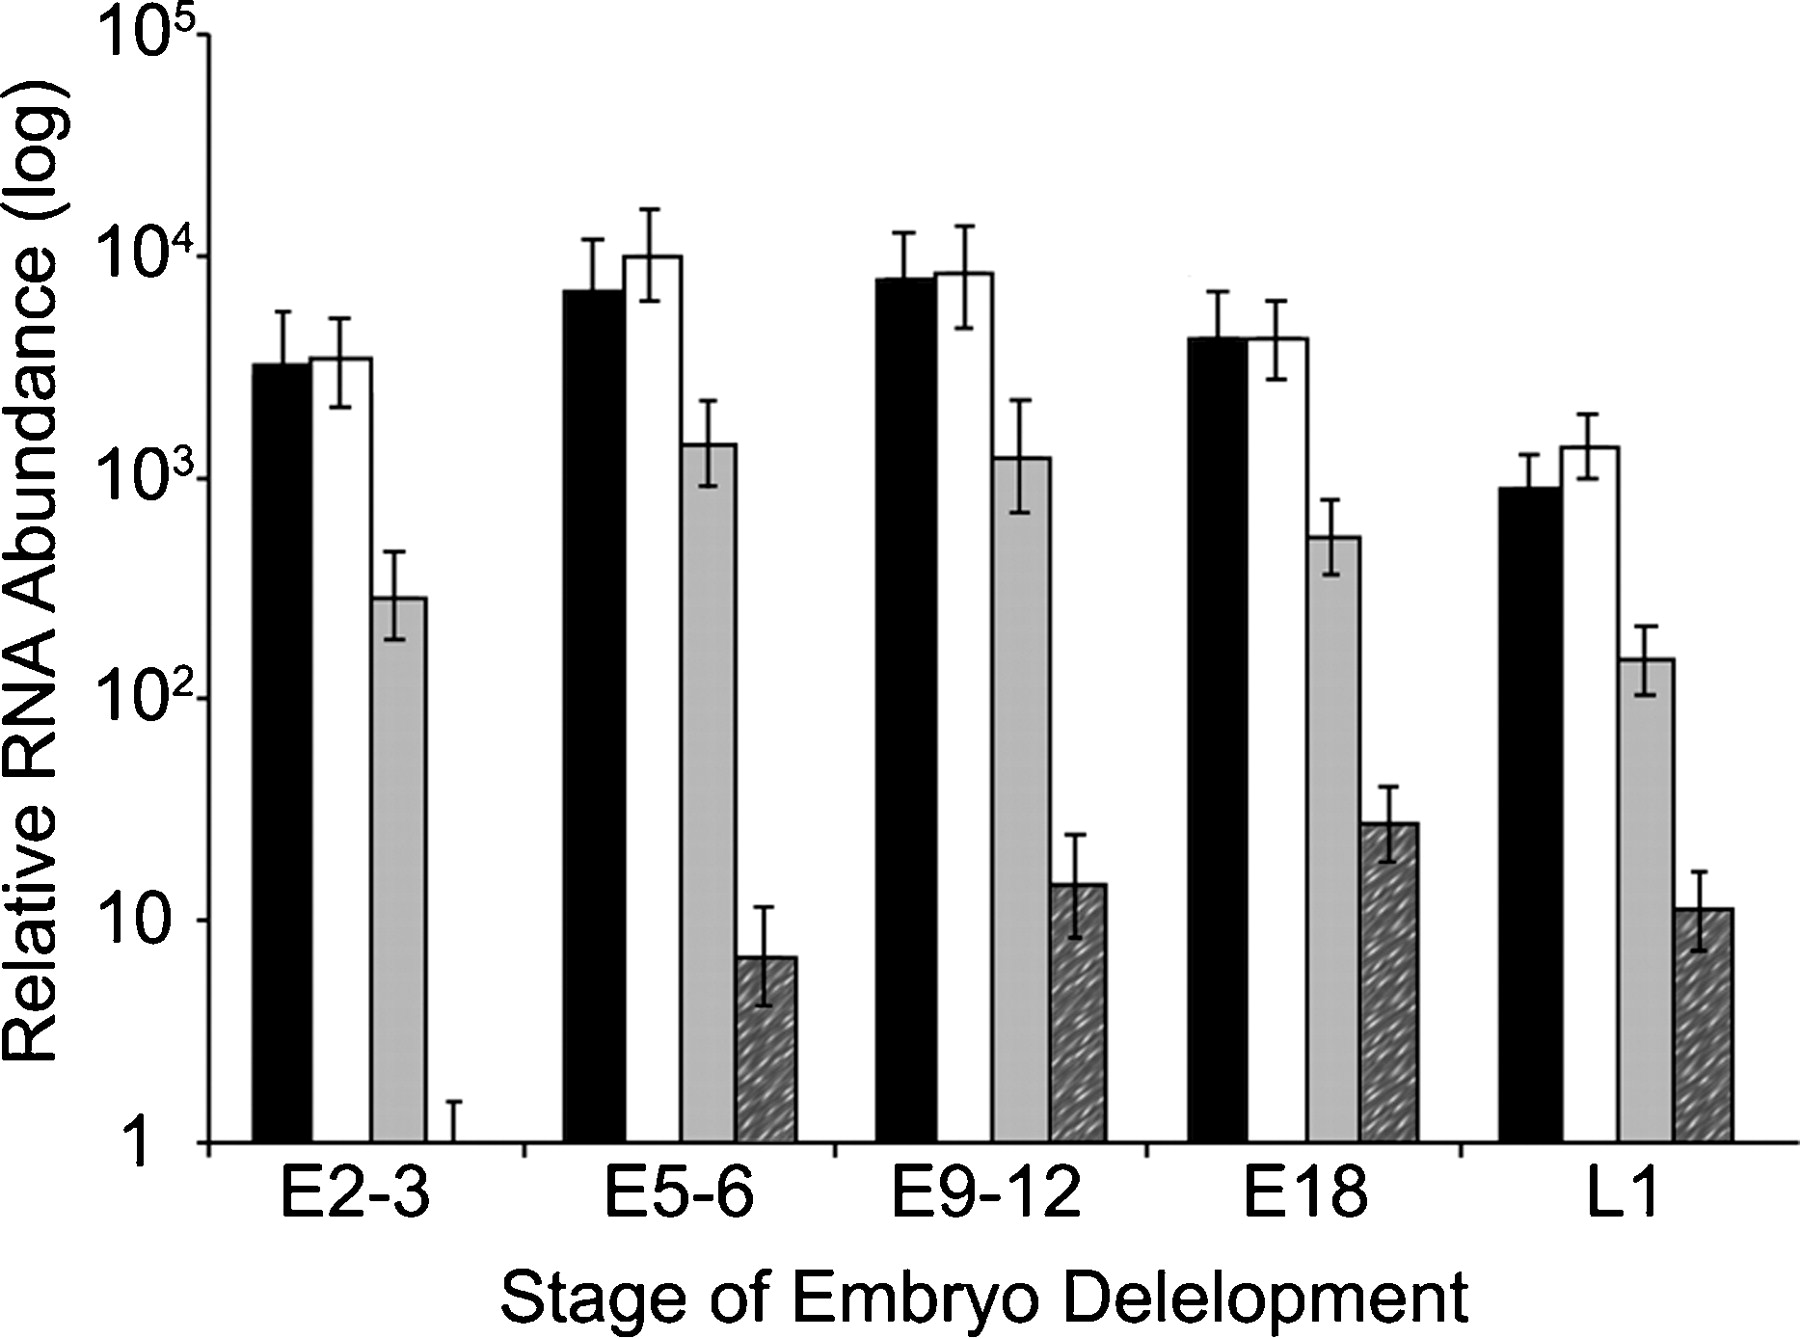
Relative quantification of hth splice variants by real-time PCR. The diagram shows the relative quantification of hth mRNA splice variants. Black bars represent relative abundance of the HTH-t amplicon, reflecting total transcriptional output from the hth gene. Relative abundance of the intron-retained and spliced BT010238 transcripts is shown as white and dark-gray bars, respectively. Light-gray bars demonstrate the relative abundance of the other known RNA isoforms detected by the cF/cR primer pair. Mean and standard deviation were calculated based on six independent values obtained in two experiments performed in triplicate. Note, the abscissa is a log scale.


