
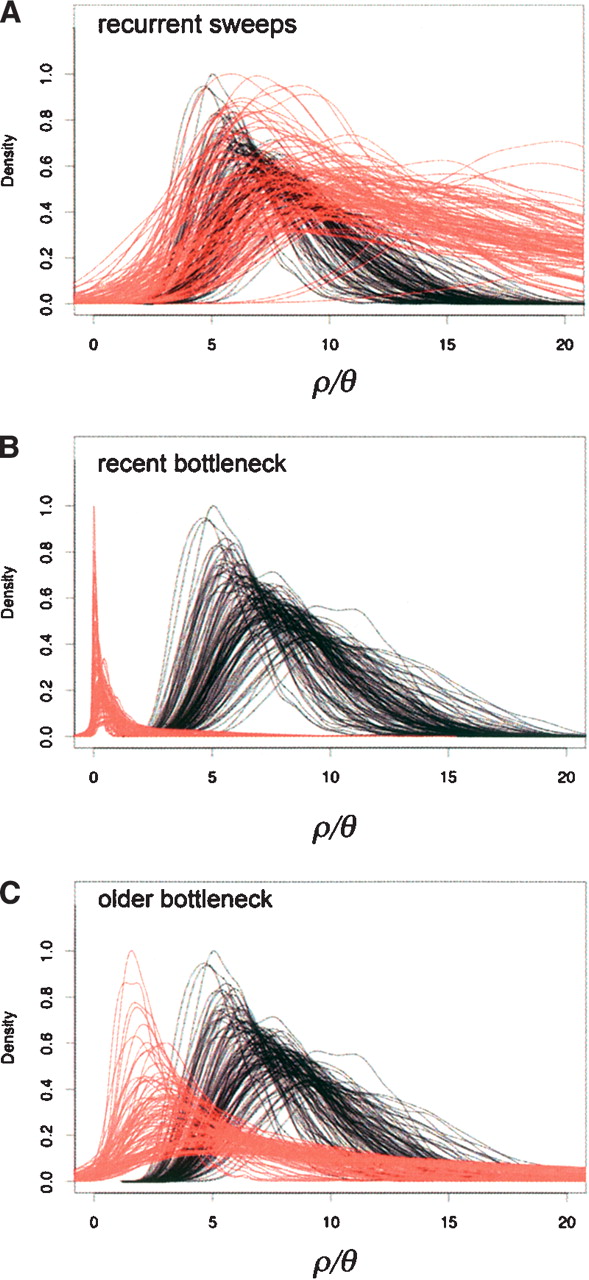
The effect of (A) recurrent hitchhiking, (B) a very recent bottleneck, and (C) a less recent bottleneck on multilocus estimates of ρ/θ. Each curve represents one of 100 simulated replicates of 10 independent loci. In red are 100 replicate distributions of ρ/θ for data simulated under sweeps or a bottleneck. In black are 100 replicate distributions of ρ/θ for the ancestral population. For the hitchhiking model (A), the relevant parameters used are the strength of selection, s = 0.005, the effective population size, Ne = 2.5 million, and the expected number of sweeps in 4Ne generations, λ = 0.00004. In bottleneck (B), the population size is reduced by a factor f = 0.05 between 0.014Ne and 0.12Ne generations ago. In bottleneck (C), we model the same reduction in Ne between 0.12Ne to 0.24Ne generations ago. For all models, the average reduction in variability (π) was set to ∼0.4 of the ancestral population θ.


