
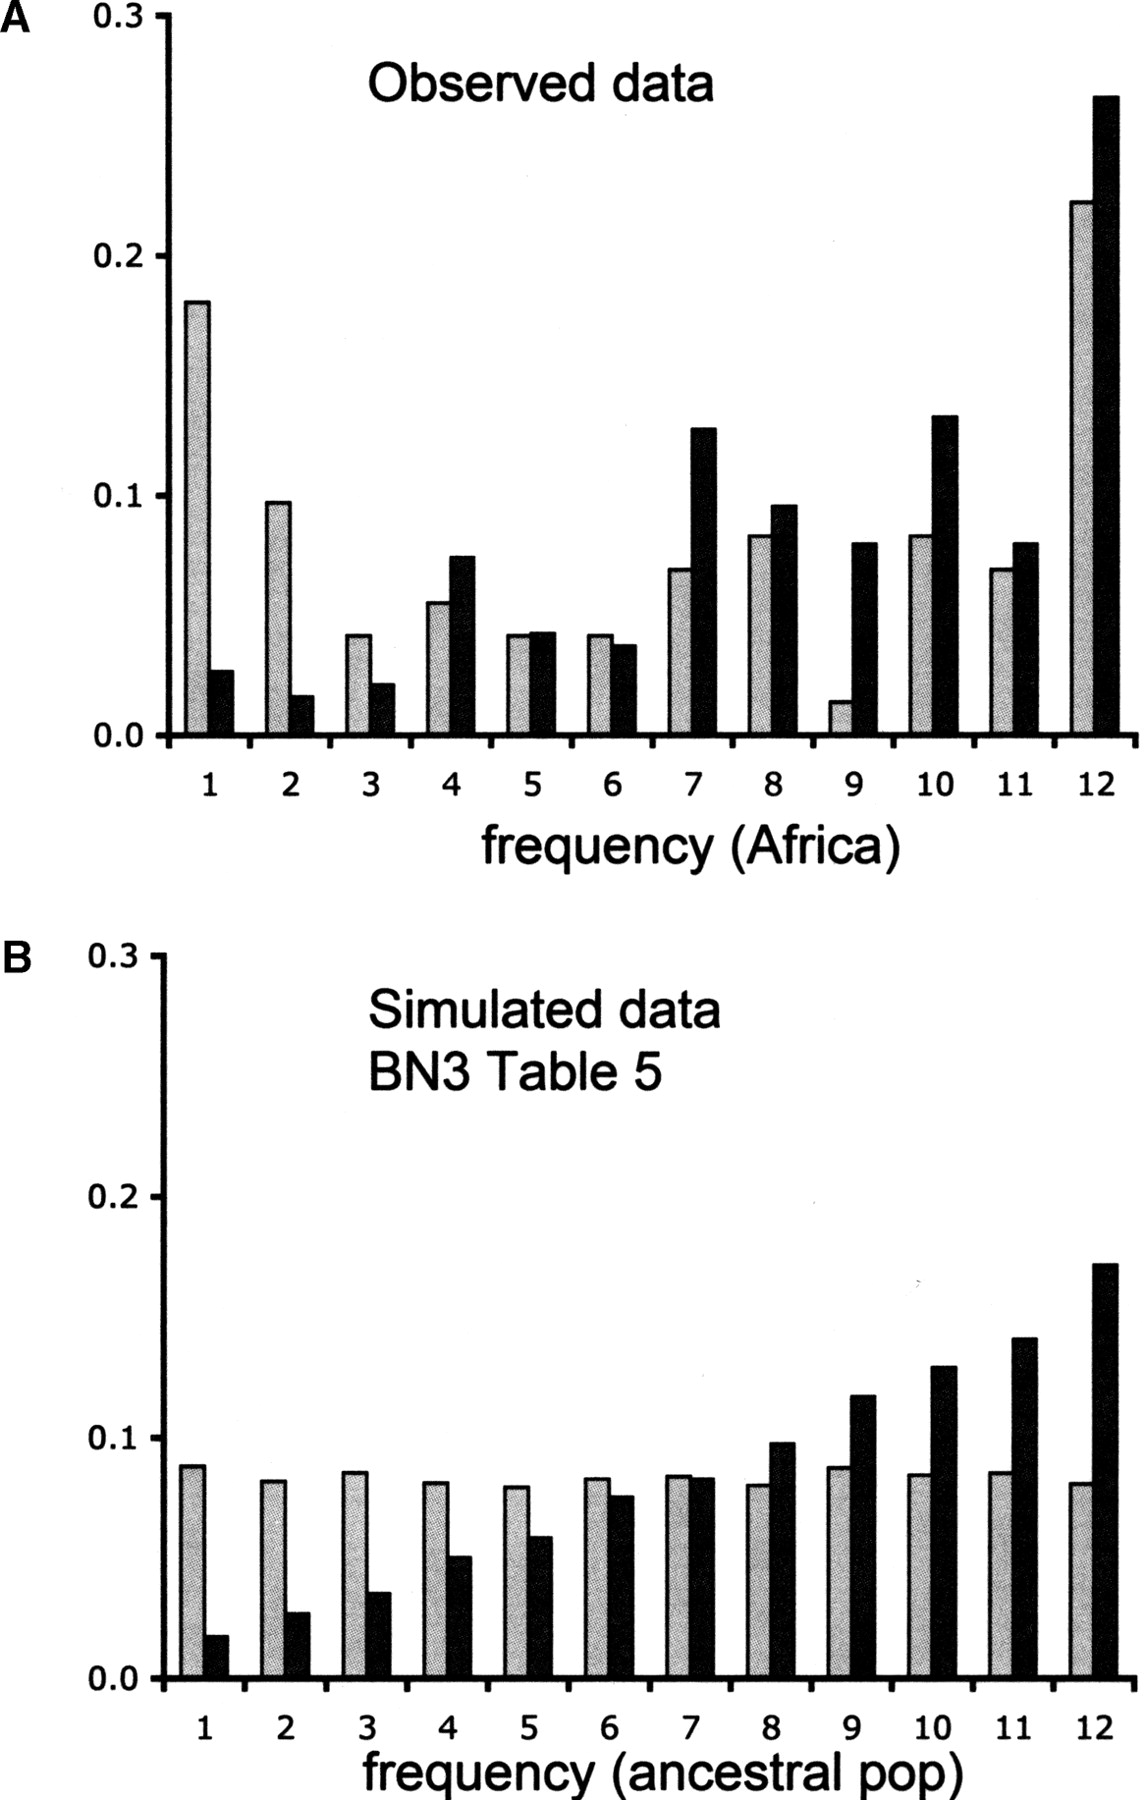
The ancestral frequencies of fixed variants in a derived population. (A) The observed data from The Netherlands population based on the 105 loci surveyed by Glinka et al. (2003). (B) Simulated data from 10,000 replicates of bottleneck model BN3 from Table 5. The x-axis plots the ancestral frequency of variants (out of a sample size of 12 individuals) that are fixed in the derived population. The light gray bars represent fragments for which estimates of θ ≤ 0.0011 per site. The dark gray bars represent fragments for which estimates of θ > 0.0011 per site. A χ2 test suggests that there is no difference between distributions of the observed and simulated data for both classes of fragments.


