
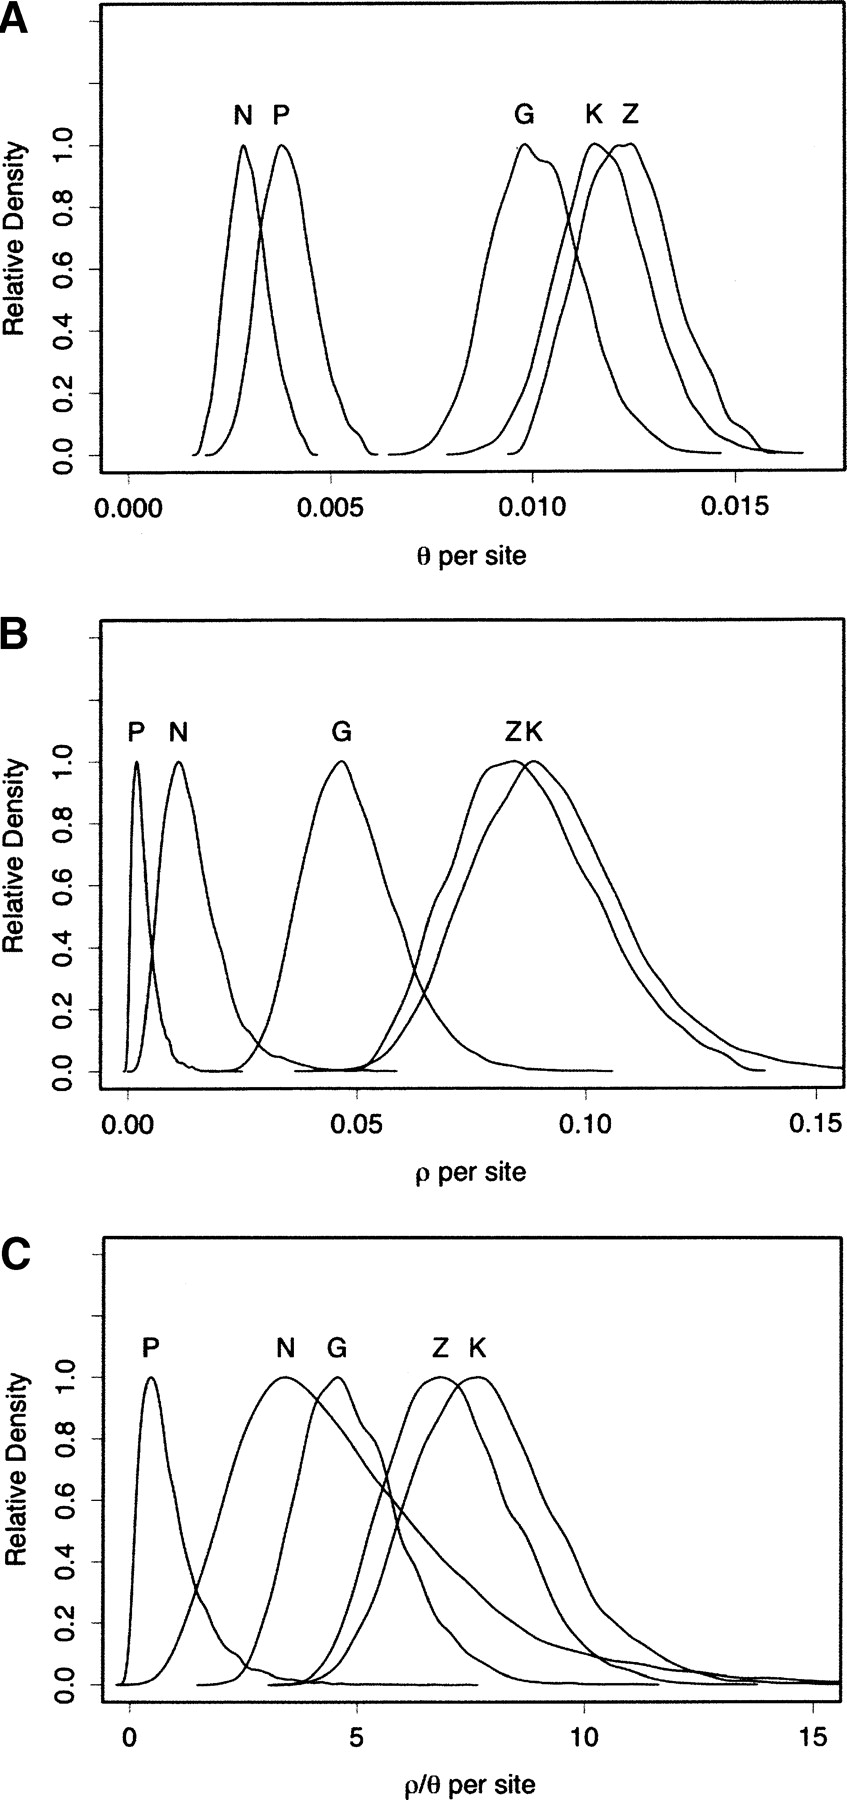
Figure 1.
Approximate Bayesian posterior distributions of (A) θ, (B) ρ, and (C) ρ/θ by population based on the 10 loci surveyed. ρ and θ were estimated jointly. N: Netherlands, P: Pennsylvania, G: Gabon, K: Kenya, and Z: Zimbabwe. The modes and 95% confidence intervals are listed in Table 2.


