
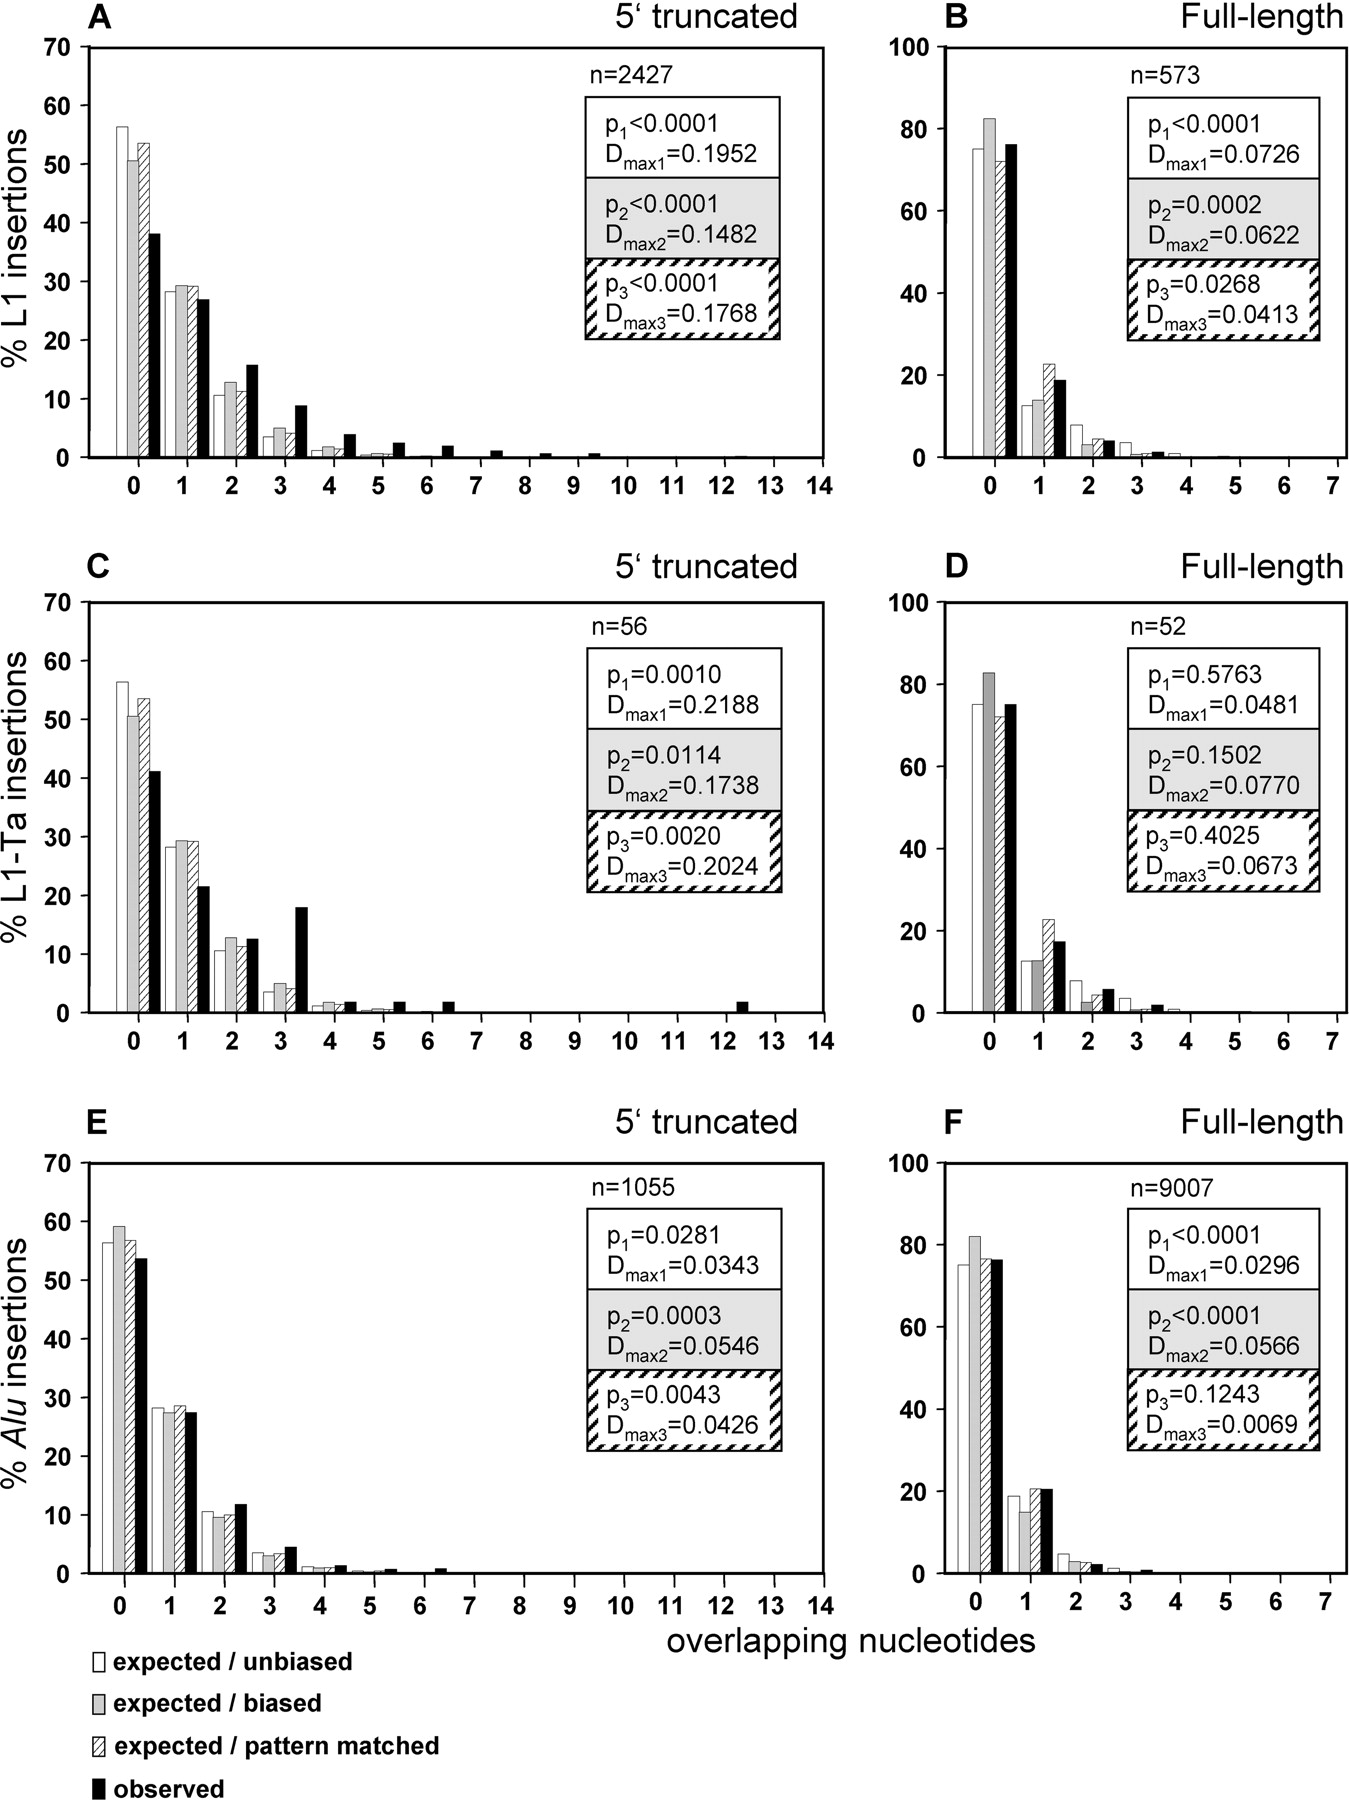
Statistical analysis of homologies at the junctions between the 5′-ends of pre-existing L1 and Alu elements and the 3′-ends of their flanking TSDs. The bar charts compare the relative numbers of expected versus observed endogenous L1- (A,B), L1 Ta (C,D), and AluY (E,F) elements with variable numbers of overlapping nucleotides shared between the 3′-end of the TSD and the 5′-truncated flank of the element. Within each of the three groups, 5′-truncated elements (A,C,E) are compared with full-length insertions (B,D,F). Open bars represent the expected distribution, assuming an unbiased base composition. Gray bars indicate the expected distribution after adjustment for the actual base composition of the elements and their target sequences (biased). Striped bars display the distribution obtained from sliding each TSD against its adjacent L1/Alu sequence and counting the hits found by “exact pattern matching.” The observed relative quantities of elements with the indicated numbers of overlapping nucleotides in their TSDs are represented as black bars. The x-axis is the number of overlapping nucleotides; the y-axis is the percentage of element insertions with the respective number of microhomologies; (n) number of endogenous elements analyzed; (p1, p2, p3) significance of the difference between expected/unbiased (expected/biased, pattern matched) and observed distribution of overlapping nucleotides (at a multiple significance level [Bonferroni-adjusted] of α = 0.025); (Dmax1, Dmax2, Dmax3) maximum absolute distance between the observed and the expected/unbiased (expected/biased, pattern matched) distribution function. The confidence intervals of the p-values are listed in Supplemental Table 1.


