
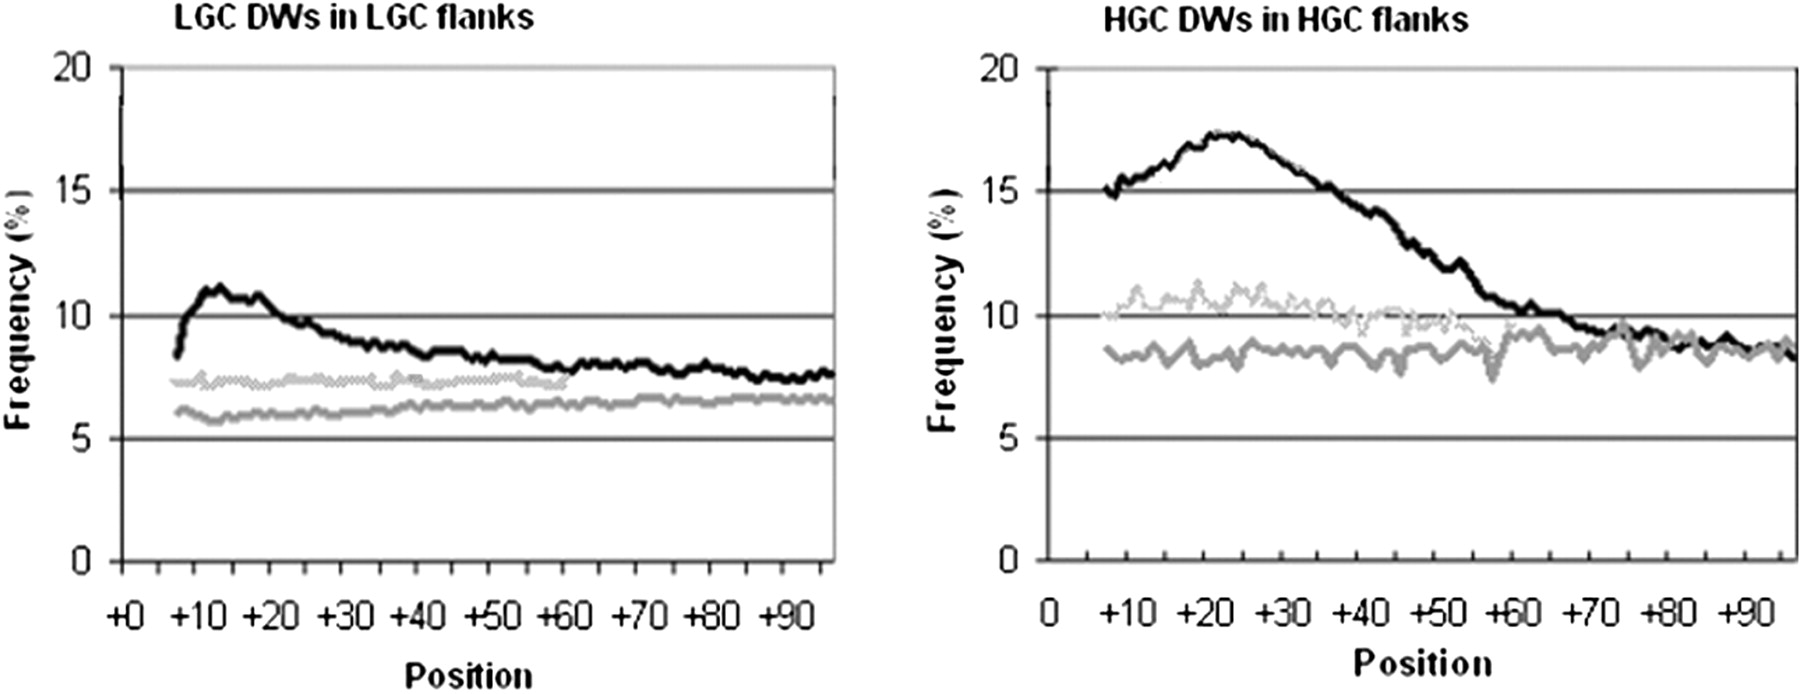
Figure 5.
Distributions of downstream winning pentamers (DW) in the flanks of HGC and LGC exons. The distribution around real exons (black curve) is compared with the distribution around pseudo exons (dark-gray curve) and after scrambling the flanks of real exons (light-gray curve). Total frequencies of each class of winners are plotted as percent. (Left) LGC winners; (right) HGC winners.


