
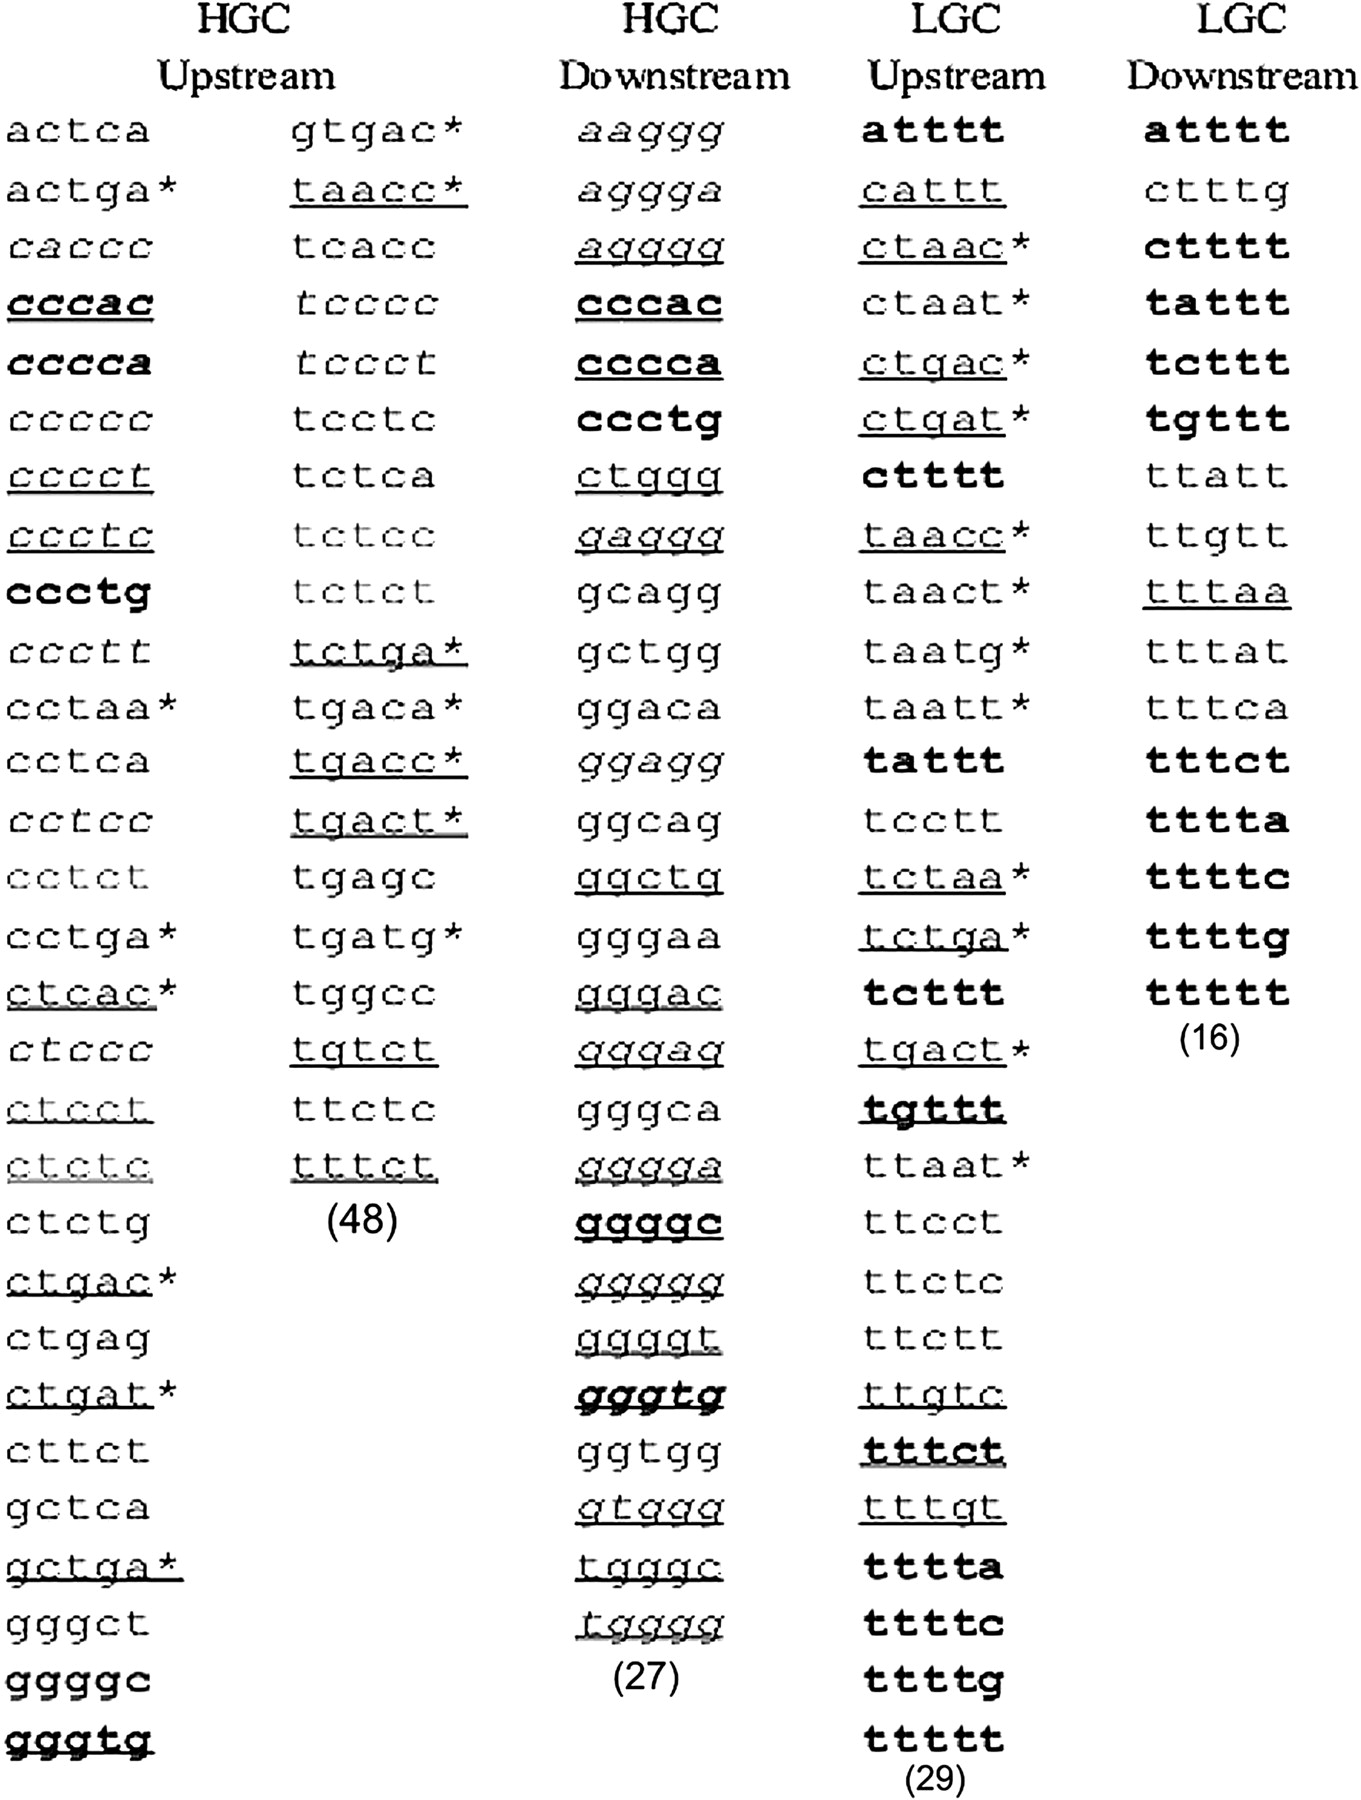
Figure 4.
Pentamer winners selected by comparing exon flanks to intron sequences with exactly the same GC% range and distributions. Winners were classified into four categories according to the GC% of their flanks (HGC or LGC) and location (upstream or downstream). Winners in italics have reverse complementary sequences as winners in the opposite flanks in the same class. Winners in bold are common to both upstream and downstream flanks in the same class. The underlined winners were also identified in a previous study (Zhang et al. 2003). The winners with asterisks overlap the branch-site consensus YTRAY.


