
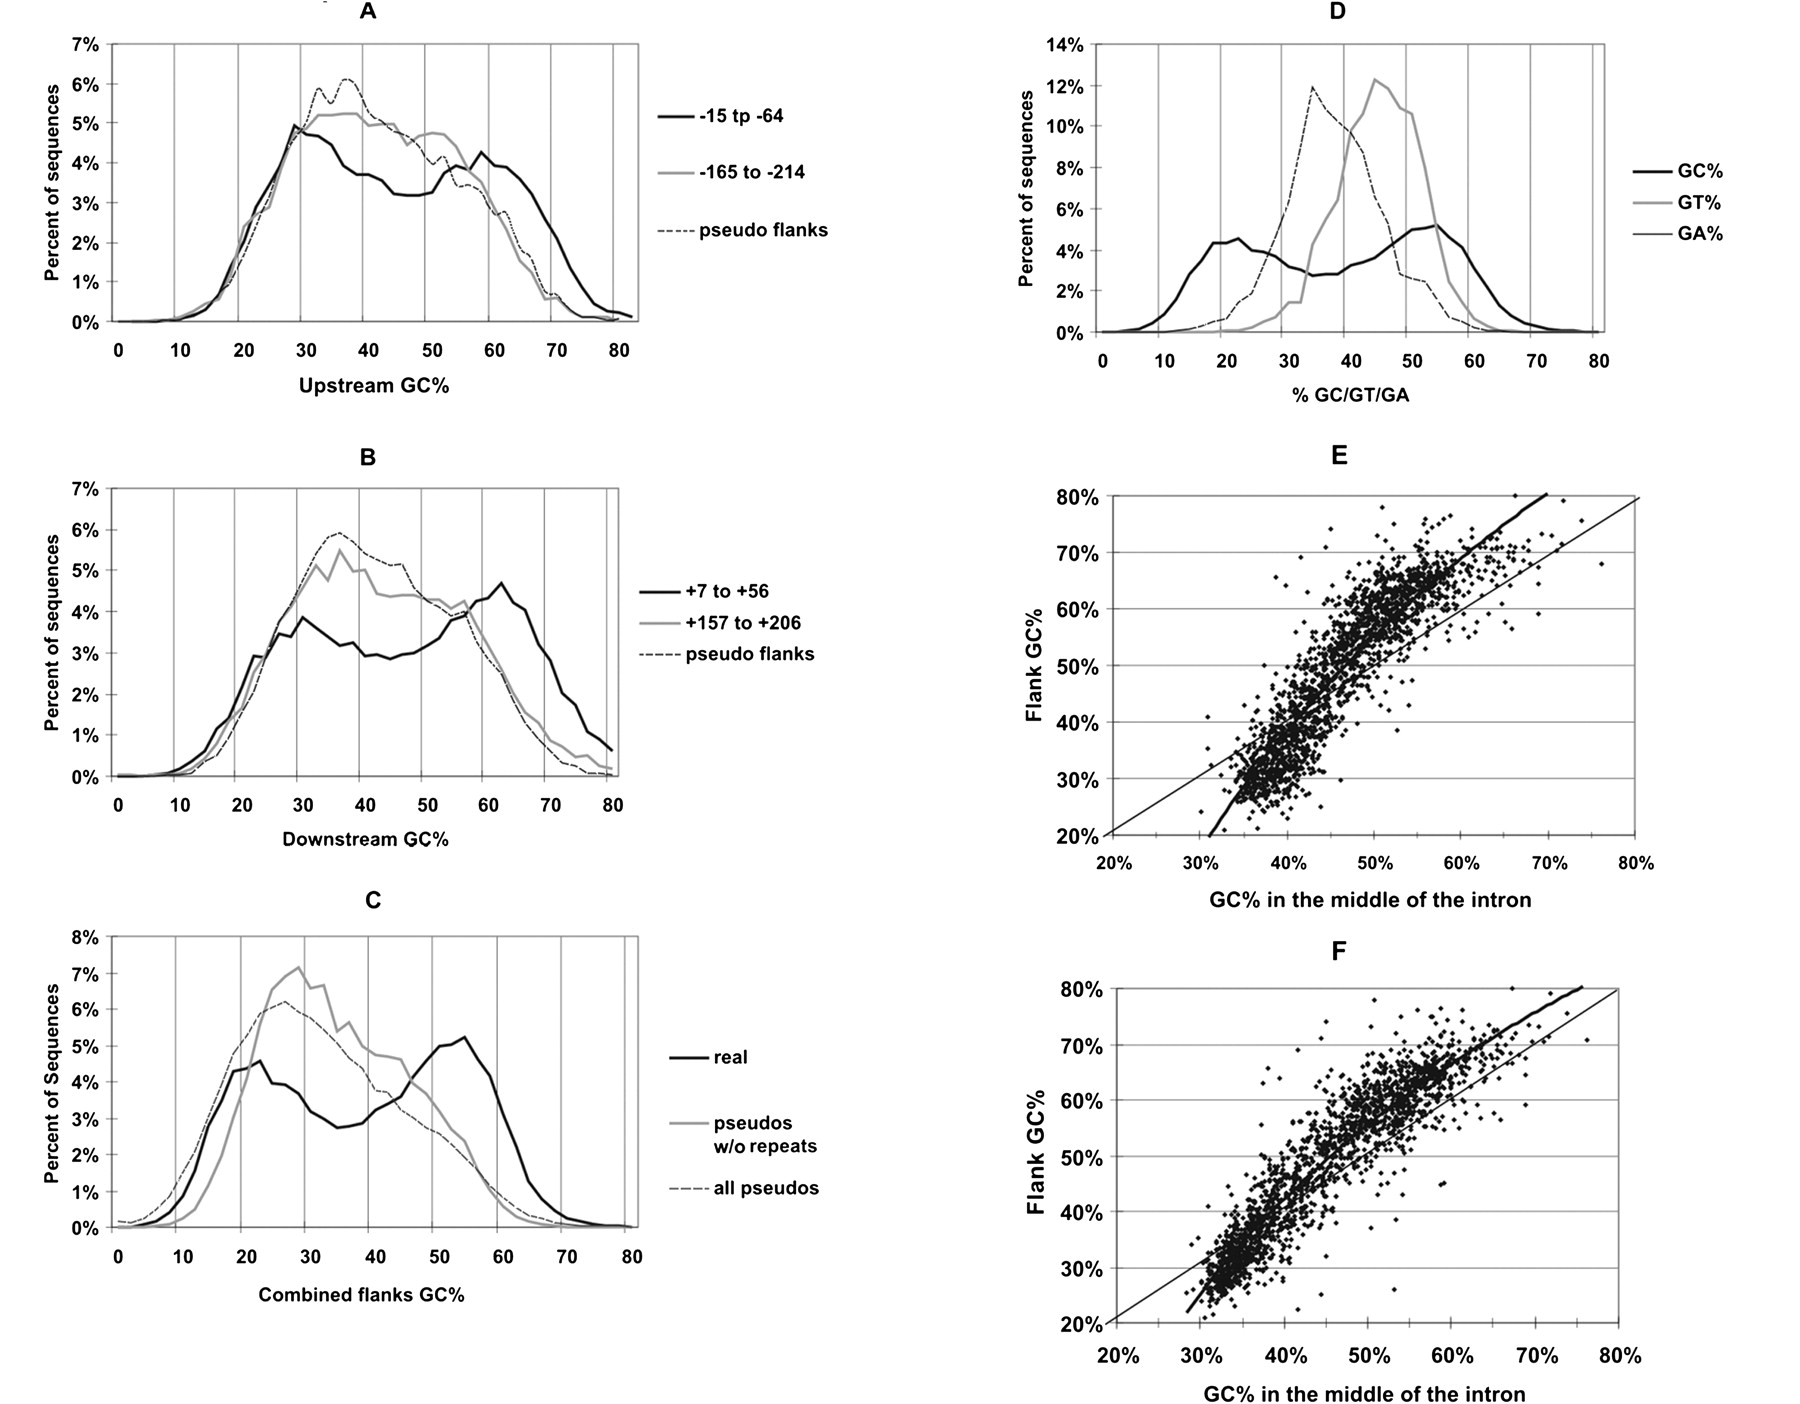
GC% distributions of flanks. (A,B) GC% distributions of 50-nt flank regions upstream and downstream of exons, respectively. The solid curves show the GC% distribution of sequence windows at the indicated distances (black curves, -15 to -64; gray curves, -165 to -214) from the 3′ or 5′ end of exons. The dashed curve shows the GC% distribution of the closer 50-nt windows in the flanks of pseudo exons. (C) GC% distributions of averaged GC% of both closest 50-nt windows (i.e., -15 to -64 and +7 to +56) upstream and downstream of exons, compared with the same distribution of pseudo exons with or without repeats. (D) GC% distribution for real exon flanks as in C compared with their GT% and GA% distributions. (E,F) Flanks tend to exaggerate GC%. (E) GC% of flanks is plotted against GC% of the remainder of the introns. (F) The same as A, but with repeats masked.


