
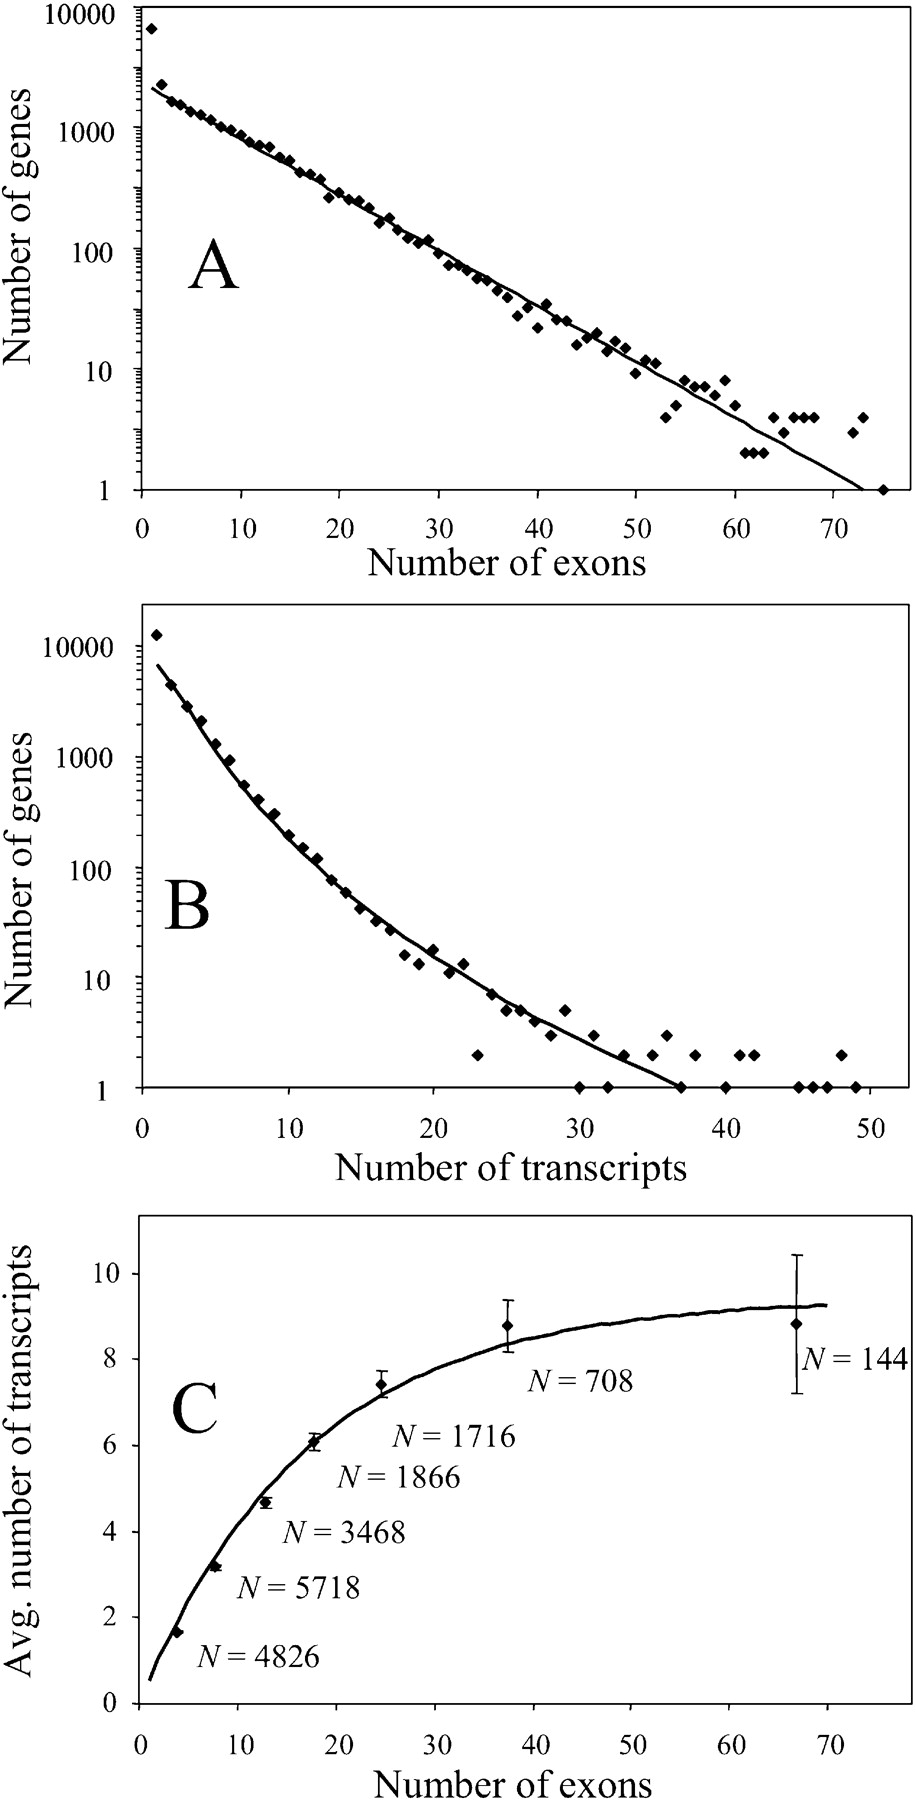
Figure 1.
Frequency distribution of protein-coding genes by the number of exons (A) and transcripts (B), and the relation between the number of exons and average number of transcripts per gene (C). Regression lines are as follows: (A) log(N) = 3.44–0.0485x; (B) log(N) = 3.72–1.32[log(x)]2; (C) N = 9.44[1–exp(–0.0574x)].


