
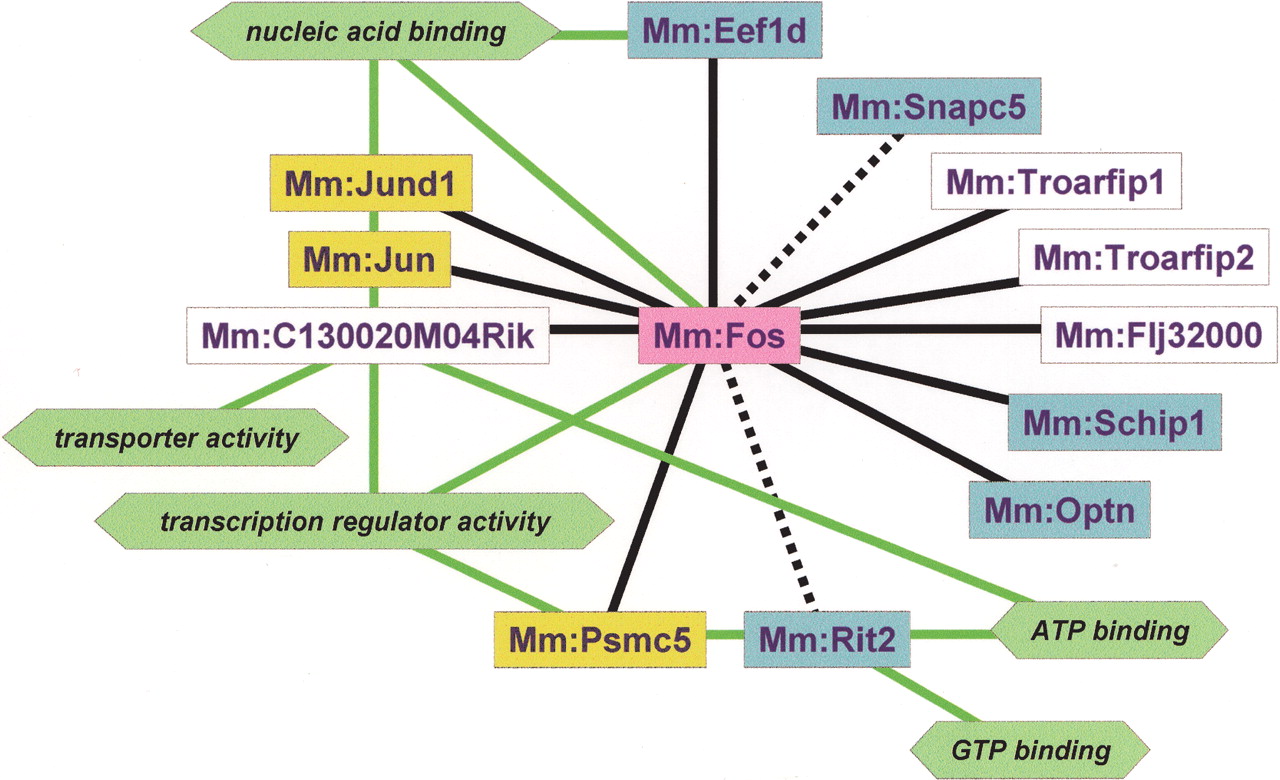
PPI map with function analysis. A PPI map including D (solid black lines) and ID interactions (broken black lines) of a positive data set (Table 1) was depicted using Genesphere (Fujitsu). Fos is a bait protein (pink square). Proteins (genes) having colored squares correspond to Table 1. (Yellow squares) Fos interaction-known proteins; (blue squares) Fos interaction-unknown proteins; (white squares) Function-unknown proteins. Several molecular functions (green hexagons with solid green lines) were analyzed with LocusLink. Transcription regulator activity; Fos, Jun, Jund1, Psmc5, C130020M04Rik, nucleic acid binding; Fos, Jun, Jund1, Edf1d, C130020M04Rik, ATP binding; Psmc5, Rit2, C130020M04Rik, transporter activity; C130020M04Rik, and GTP binding; Rit2. Molecular functions were defined in the gene ontologies of MGI (http://www.informatics.jax.org/searches/GO_form.shtml).


